
The S&P 500 keeps rallying to new highs, breaking down historical relationships with several metrics. It is possible the Fed’s expanding balance sheet is causing all this divergence. If it is, then the central bank will stop expanding its asset base by the middle of next year.
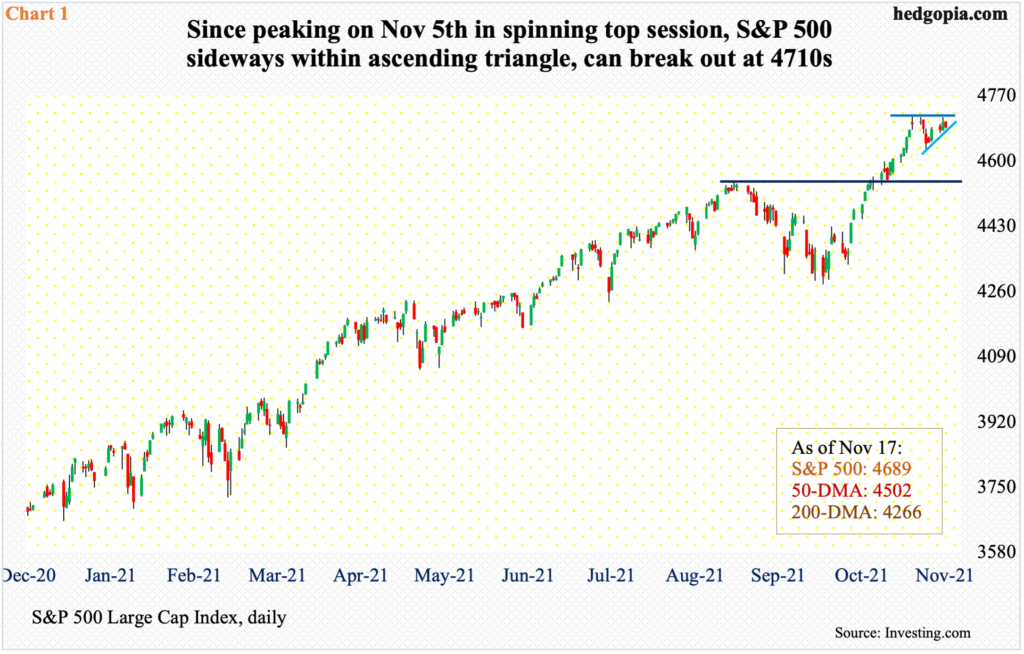
The S&P 500 (4689) continues to hover around its record high posted nine sessions ago. The November 5 high of 4719 came in a spinning top session, followed by a doji on the 6th. The subsequent drop bottomed at 4631 on the 10th. Since that low, the large cap index has inched higher with higher lows, even as rally attempts have been denied at 4710s. As a result, an ascending triangle has formed (Chart 1). The index will break out at 4710s.
Concurrently, the 10-day moving average, which was rising until just a few sessions ago, is now beginning to flatten out. It lies at 4682, which is where the rising line of the triangle rests. In other words, the S&P 500 sits at an interesting juncture. It can break out as easily as it can break down. If weakness follows, it would have come after a 10-percent rally through the Nov 5 high.
Conditions are grossly overbought, and unwinding should not be too surprising.
The S&P 500 is up just under 25 percent this year and has gone parabolic since the low of March last year, surging 115 percent. In doing so, it has diverged with several metrics, two of which are mentioned below.
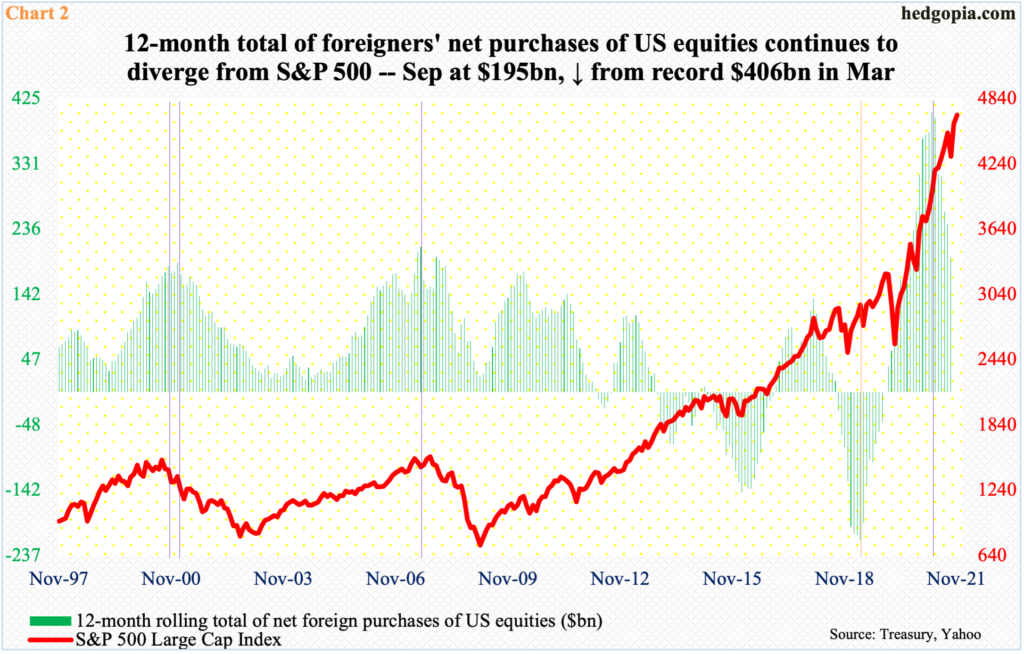
The index tends to correlate well with foreigners’ buying behavior. In April 2019, the 12-month total of their net purchases of US stocks peaked at minus $214.6 billion, meaning they were selling that much, which was a record. By December that year, the green bars in Chart 2 turned positive. Gradually, they aggressively began buying. The 12-month total reached as high as $405.6 billion in March this year, before backing off and decelerating to $194.7 billion in September. The S&P 500, in the meantime, has continued higher.
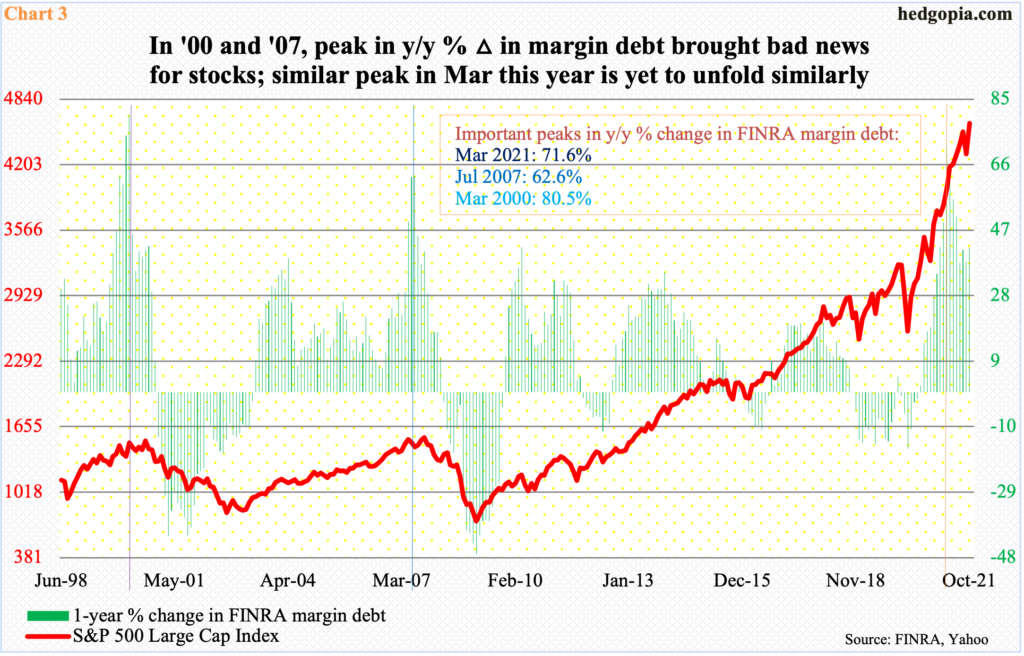
Then there is FINRA margin debt, which going back to nearly 25 years maintains a correlation coefficient of 0.95, which is very tight – as good as unity (chart here). In October, the S&P 500 jumped 6.9 percent and margin debt 3.6 percent – both to new highs. The $32.7-billion jump in margin debt in October took it to $935.9 billion, up $456.6 billion from March last year. In this respect, they have both moved together. But the two have diverged using one-year percent change.
In October, margin debt jumped 41.9 percent from a year ago, which is phenomenal growth but at the same time is much weaker than the 71.6-percent growth registered in March this year. This was in line with major peaks in 2000 and 2007. Back then, margin debt shot up 80.5 percent and 62.6 percent in March and July respectively, and they each either coincided with or preceded major peaks in the S&P 500.
This time around, the two have diverged (Chart 3) – at least thus far.

It is possible Chart 4 is causing a breakdown in these relationships.
The Federal Reserve aggressively began expanding its balance sheet in March last year. That was when the S&P 500 put in a major low. Both have gone vertical since. The balance sheet more than doubled from $4.24 trillion in early March last year to $8.66 trillion. The Fed buys up to $120 billion a month in treasury notes and bonds ($80 billion) and in mortgage-backed securities ($40 billion).
Now, it is getting ready to taper, intending to end the program around the second half of next year, by which time its assets would have crossed $9 trillion. Going by how things evolved in prior three iterations of quantitative easing, this is bad news for equity bulls – unless this one, too, experiences a divergence. Alternatively, it is possible the breakdown in relationships in Charts 2/3 will gradually begin to mend itself; right here and now, odds favor this scenario better.
Thanks for reading!
