
SPY, the SPDR S&P 500 ETF, has essentially gone sideways since January 20th. That was the first low of the year after a 12-session, 11-percent waterfall drop. A subsequent eight-session rally had the ETF rally to $194.58, before it again headed back lower.
The January 20th low has yet to be breached. Correspondingly on the S&P 500 index, 1800 held.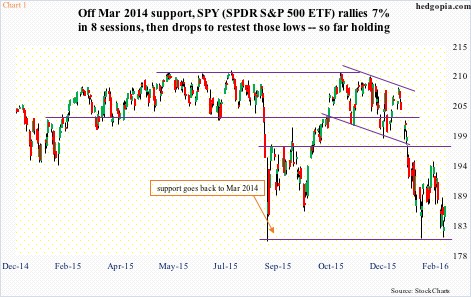
On a daily chart, the January 20-February 11 consolidation looks similar to the August 24-September 29 congestion last year (Chart 1). That bore fruit. By November 3rd last year, SPY rose 13-plus percent to $210.41. Is a similar move imminent? Too soon to say.
In the right circumstances, there is room to rally.
Technical conditions are as oversold. Some sentiment measures are as pessimistic, if not more. Investors Intelligence’s bullish percent dropped to 24.7 last week. That was also the reading on September 29th (2015). Bears back then were 35.1 percent. Now they are 39.2 – the highest since October 19, 2011 (41 percent).
That said, signs of a bear market were not as stark as they are now. So if a rally follows, it would have taken place within the context of a bear. And that is a crucial difference.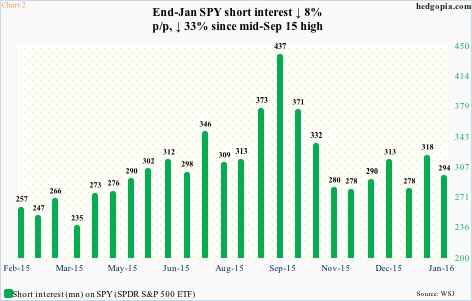
Another is how shorts are positioning. Right before stocks bottomed in late September, the ETF’s short interest had surged to 437 million, which in the next two months contracted to 278 million (Chart 2). That was such a tailwind for the ETF. In the latest period (end of January), short interest fell eight percent to 294 million – lower than the one-year average of 304 million.
In the futures market, however, net shorts in e-mini S&P 500 have been rising. As of last Tuesday, these contracts totaled 234,321, having risen from 75,348 in the middle of December. During September-October last year, net shorts peaked a week after stocks troughed at 278,179 contracts before persistently dropping to that mid-December low (Chart 3).
Net shorts are high enough to potentially cause a squeeze, should the bulls get their act together.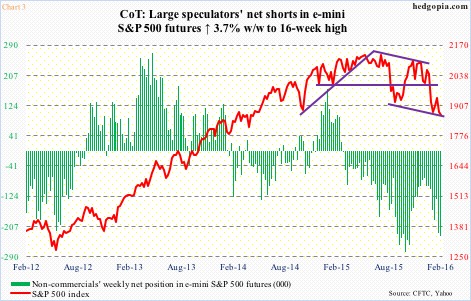
The first line of resistance SPY ($186.63) faces lies at $188, which last Wednesday already repelled a rally attempt. This resistance goes back to the middle of 2014. This is where 10- and 20-day moving averages – both still dropping – converge as well. They need to be taken over. The corresponding resistance on the S&P 500 lies at 1880.
Rather encouragingly for the bulls, spot VIX is throwing off signs of exhaustion. Since the middle of January, VIX spiked over 30 three times only to reverse hard (Chart 4). Each of these spikes took place right outside the upper Bollinger Band. On a daily chart, the odds of the so-called fear index continuing lower have risen – at least near-term. Support lies at 20-ish, followed by 50- and 200-day moving averages (21.47 and 18.07, respectively).
Put all this together, and there might be a trade brewing on the long side. Rather than going long the underlying straight, options can help.
February 19th weekly SPY 185.5 puts bring $1.86. If put, it is a long at $183.64.
Thanks for reading!
