
Stocks have diverged from sharp deterioration in fundamentals. At the lows, several indicators were at washout levels, resulting in the massive rally that followed. But at this point in time, they may be responding more to the Fed’s monetary backstop and hoping the substantial monetary and fiscal stimulus unleashed in the past couple of months results in a V-shaped recovery. Bulls will be thrown a curve ball if it turns out to be a W or a U or an L.
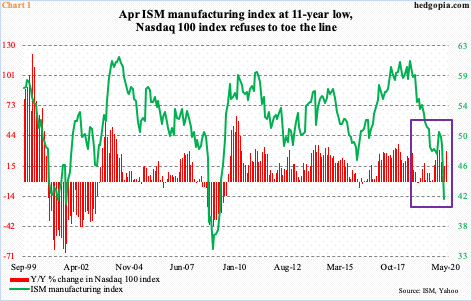
In April, the ISM manufacturing index tumbled 7.6 points month-over-month to 41.5. Manufacturing had been weakening for a while, as two of the last nine months came in sub-50. Nonetheless, April’s was the largest m/m drop since October 2008 and the lowest reading since April 2009.
Yet, you would not know this looking at how stocks are behaving, particularly tech. The Nasdaq 100 Index, and other major US equity indices, had a rough one month in February and March. The recovery since the March 23rd low has been nothing short of phenomenal.
At the lows in March, the Nasdaq 100 was down 22.5 percent for the year, now it is up 5.6 percent and is merely 5.6 percent from the February 19th record high of 9736.57. Last Friday, the index (9220.35) closed right at gap-down resistance at 9200. Three hundred more points and the gap gets filled. After that, bulls would be eyeing the all-time high from February.
Historically, the Nasdaq 100 tends to move together with manufacturing activity. This time around, the two have diverged (box in Chart 1). At the lows in March, several indicators dropped to extremely oversold levels. This needed to unwind.
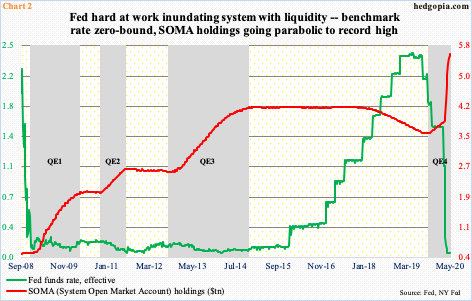
Concurrently, the Fed got active. Not only did it lower the fed funds rate by 150 basis points in two emergency meetings in March, but also aggressively expanded its balance sheet. At a range of zero to 25 basis points, the benchmark rate once again is zero-bound. In other words, the conventional tool is done with, hence the adoption of unconventional tools.
During the financial crisis of 2007-2008, too, the Fed increased its balance sheet through quantitative easing (QE), through which it bought Treasury and mortgage-backed securities. Now, it has broadened into municipal and corporate debt, including junk bonds. The QE is open-ended.
As of last Wednesday, its balance sheet stood at $6.72 trillion. SOMA (System Open Market Account) holdings were $5.59 trillion, which has gone parabolic since early March (Chart 2). This has no doubt helped improve investor sentiment. Equity bulls are using this as an opportunity to squeeze shorts.
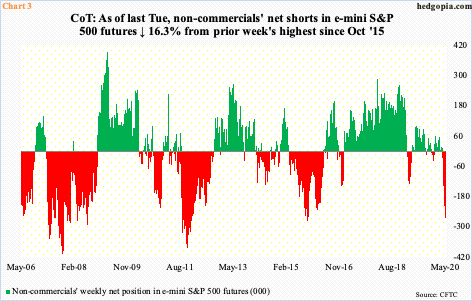
As of Tuesday last week, non-commercials were net short 222,414 contracts in e-mini S&P 500 futures, down from prior week’s 265,608, which was the highest since October 2015. As recently as the week to March 24th, these traders were net long 12,688 contracts (Chart 3). That was when stocks bottomed. Non-commercials used the subsequent rally to aggressively add to shorts – until last week when they reduced their holdings by 16.3 percent. Bulls hope this continues.
In the meantime, US money-market assets last week were $4.77 trillion – yet another record (chart here). Cash continues to build on the sidelines even as AAII bears at 52.7 percent last week were the highest since April 2013. In the past, these levels of bearishness marked major bottoms in stocks. The thing is, when stocks were bottoming late March, AAII bears were 52.1 percent. Even after the massive rally off of that low, they are still stuck there. Ideally, bulls would love these bears to gradually join them. Continued short squeeze is possible in this scenario.
Bears look around and find sufficient reasons to stay bearish. Besides the ongoing collapse in the economy, there are several divergences that fail to confirm the prevailing rally in stocks. Large-caps continue to lead. Last Friday, 95 percent of Nasdaq 100 stocks were above their respective 50-day. In contrast, 76.9 percent of Nasdaq stocks were above the average. Things are increasingly top-heavy.
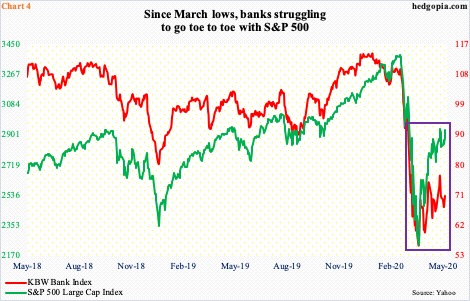
Concurrently, banks – as significant a sector as it is – continue to struggle. Off the March lows through April 29th, the KBW Bank Index rallied 23 percent before pulling back slightly. It currently sits right on its 50-day. The S&P 500 large cap index (2929.80), on the other hand, rallied just under 35 percent, is over seven percent away from its 50-day and is within striking distance of the April 29th high of 2954.86.
The divergence between the two indices (box in Chart 4) cannot continue. In due course, either the laggard follows the leader higher or pulls it down.
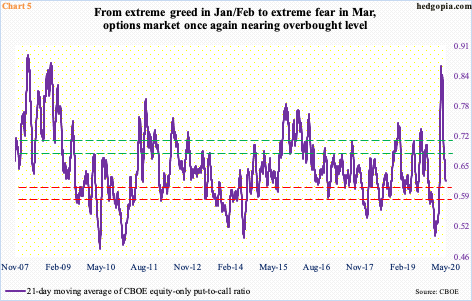
At the March lows, several indicators reached washout levels. The CBOE equity-only put-to-call ratio was one of them. On January 17th, the 21-day average hit 0.506, which was the lowest level since July 2014 (Chart 5). It continued to linger in low-0.50s until the S&P 500 peaked on February 19th. The collapse in the index that followed pushed up the ratio, which then peaked at 0.867 on March 20th. This was the highest since November 2008. Fear was palpable back then, as was greed in January and February this year. Once again, greed is taking over. It has not quite reached the levels of early this year, but at 0.621 last Friday, it is rapidly approaching overbought territory. Bulls are hoping the ratio continues to drop toward excessive optimism – like the one seen in January and February. In this scenario, non-commercials get squeezed (Chart 3).
Bulls are currently eyeing the trillions of dollars in stimulus money – both fiscal and monetary – and hoping for the best. In the best-case scenario, a cure for Covid-19 – either therapeutic or vaccine – is found sooner than later and the economy snaps back with vigor. Increasingly, stocks are pricing in a V-shaped recovery, not a W or a U or an L. The reality may be otherwise. Macro data are weakening, and, if past is prelude, once they set in place, these things stay around for years. Time will tell. This is the risk facing longs that are particularly building positions now.
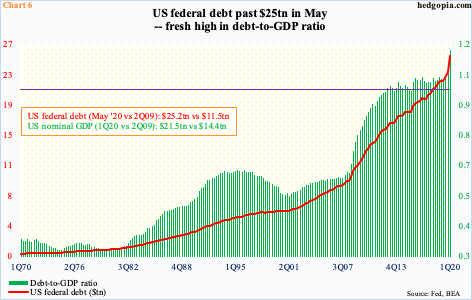
Longer-term, debt, which was at the crux of the 2007/2008 financial crisis, continues to accumulate. US federal debt just crossed $25 trillion. In Chart 6, debt is current while GDP is as of 1Q20. Both the debt-to-GDP ratio and US debt are at new highs (Chart 6) – and set to go higher.
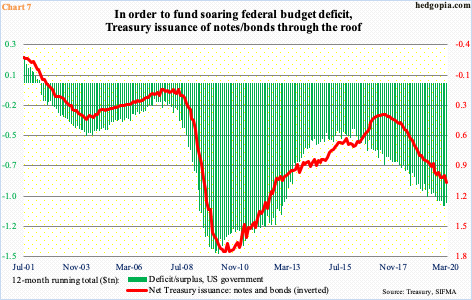
The Congressional Budget Office (CBO) projects the federal budget deficit to surge to $3.7 trillion this fiscal year, which ends in September, and $2.1 trillion next year. Revenues at the same time will come under pressure. Borrowing obviously needs to go substantially higher to fund this deficit. Chart 7 will look a lot worse in the months/quarters to come. CBO’s projections are as of April 24th and obviously include spending enacted to that point. It is an election year. More stimulus money is probably on the way.
The surge in the deficit this fiscal year compares with just under $1 trillion in red ink last year. CBO expects real GDP to contract 5.6 percent this year and grow 2.8 percent next. Time will tell, but there is lot of optimism build into this model. For this year, it assumes the economy contracts in 1Q and 2Q and then grow in 3Q and 4Q. GDP is expected to come in at $20.4 trillion this year. If these projections are right, the $1-trillion-plus reduction in GDP will be more than offset by the stimulus money. This is what equity bulls are currently focused on. If their most optimistic scenario comes to pass, stocks push higher still. But they are also increasingly at a point where each successive move higher raises the risk of a reversal. We just have to go back to January and February to see how this can play out.
Thanks for reading!
