
Post-presidential election last November, U.S. small-caps sprung to life, going nearly parabolic in two separate spurts. President Trump’s promises to cut taxes, prune regulations and increase infrastructure spending helped improve investor sentiment. Small-caps inherently are domestically focused.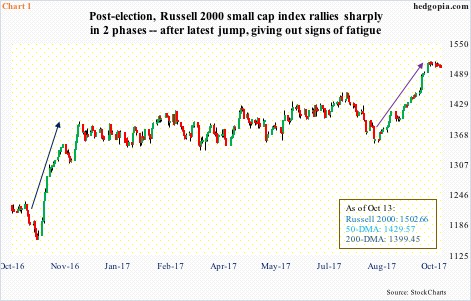
The first rally lasted a month – from November 9 through December 9 last year – yielding 16.5 percent on the Russell 2000 small cap index. The second one – from August 18 through October 5 this year – was good for 12.3 percent.
After the first one (dark blue arrow in Chart 1), the index went on a sideways-to-slightly-up journey for months. As regards the second one (violet arrow), it has gone sideways to slightly down in the last nine sessions, having reached an intraday all-time high of 1514.94 on October 5.
The question is, might the recent sideways action be similar to the first one, which, after a long consolidation, led to a breakout? The bulls hope so.
But how likely is this scenario? Better yet, are the required variables in place?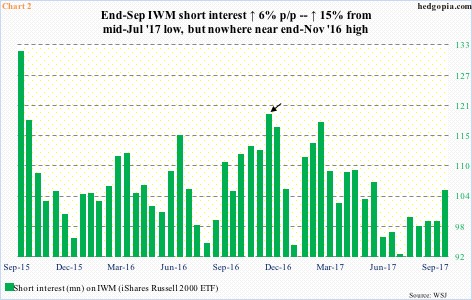
When the Russell 2000 took off last November, this was preceded by an 8.5-percent, two-month decline. Short interest on IWM (iShares Russell 2000 ETF) had built up to 119.1 million by the end of November (arrow in Chart 2). Then came the squeeze. By the middle of January, short interest had shrunk to 93.7 million. This probably acted as a source of tailwind to IWM/Russell 2000.
Another source was non-commercials, who went from 19,777 net longs in Russell 2000 mini-index futures mid-November to 92,652 early January. This was a case of longs showing conviction, not so much shorts fleeing.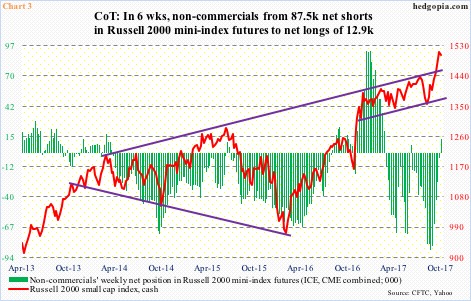
In the rally that began this August, it was the other way around. Non-commercials got squeezed big time. In six weeks, they went from 87,499 net shorts to 12,933 net longs.
The August 18 intraday low on the Russell 2000 also coincided with the release by the White House of a much-awaited tax plan, which plans to cut the corporate rate from 35 percent to 20 percent. For individuals, the top rate would drop from nearly 40 percent to 35 percent, and the bottom rate would rise from 10 percent to 12 percent.
Investor reaction was quick.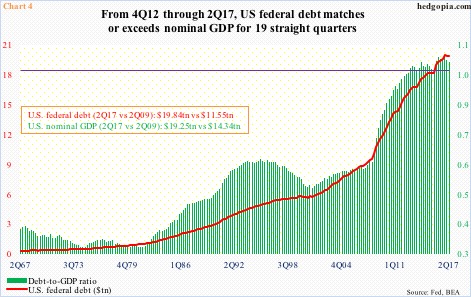
But, nearly two months after the announcement of the tax plan, reality is sinking in. It is nearly impossible it passes Congress in its current form. The federal debt just crossed $20 trillion, with a debt-to-GDP ratio north of one for 19 straight quarters (Chart 4). Deficit hawks are wary of adding to deficit.
Combine this with major Fibonacci resistance on the Russell 2000, the bulls have their work cut out for themselves – at least for now. The index just reached 161.8-percent Fib extension of the June 2015-Feb 2016 decline.
More often than not, this resistance can cause a rally to pause/reverse. In the case of the Russell 2000, since the February 2016 low, it rallied nearly 61 percent – probably time to give some of this back. Particularly so as short-squeeze tailwind is lacking.
Thanks for reading!
