
Helped along by massive short squeeze and healthy flows into ETFs, small-caps have broken out to 161.8-percent Fibonacci-extension resistance.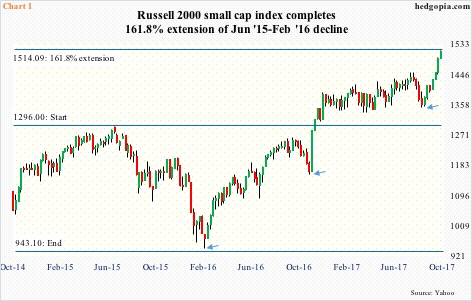
Most recently, the Russell 2000 small cap index bottomed on August 18, and has gone on to rally 12-plus-percent since. In the process, it not only reclaimed the 50- and 200-day moving averages but also broke out of months-long rectangle as well as a rising wedge.
This arguably is just a follow-up to a rally that began after last November’s presidential election, during which the index shot up 16.5 percent in a month before getting on a months-long sideways journey.
As a matter of fact, we can even go all the way back to February last year, when the Russell 2000 – along with its major U.S. peers – reached a major bottom. This was preceded by a 27-plus-percent collapse between a then-high of 1296 and the February 2016 low of 943.1. Since that low, the index has surged nearly 61 percent! That low and high are relevant here.
Last week’s high of 1514.94 represents – almost on the dot – a 161.8-percent extension of that decline (Chart 1). In Fibonacci circles, this is an important number, and traders pay close attention to it. More often than not, this can mark a meaningful pause, if not an outright reversal.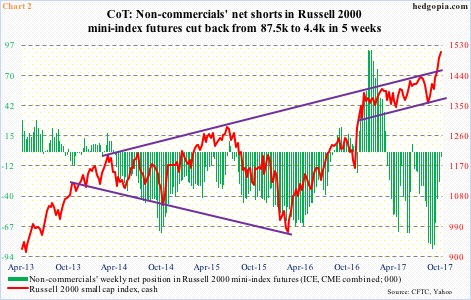
Importantly, this has come in the wake of a near-parabolic run, with six of the last seven weeks up. Even more important, this has coincided with a massive squeeze among non-commercials in futures.
In the week through August 29, non-commercials’ net shorts in Russell 2000 mini-index futures peaked at 87,499 contracts. Right around that time, the cash rallied past the 200-day. Then began the squeeze. By last Tuesday, these traders had cut back their holdings to 4,435. This has been a big source of tailwind to the cash, which also means this is just about spent up.
Now the question is, would non-commercials begin to accumulate net longs?
Post-election through the week ended January 3, non-commercials did indeed go from 18,999 in net shorts to 92,652 in net longs. The bulls for sure hope the current trajectory evolves in a similar fashion.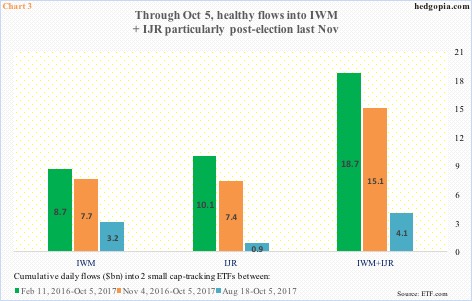
It will help if flows continue to cooperate. Thus far, Russell 2000-focused ETFs have attracted decent sums.
Chart 3 plots flows into IWM (iShares Russell 2000 ETF) and IJR (iShares core S&P small-cap ETF) beginning three dates – February 11 and November 4 last year and August 18 this year. Each of them marked important bottoms in the Russell 2000 (arrows in Chart 1).
From August 18, for instance, IWM and IJR pulled in a combined $4.1 billion – and $15.1 billion from the November low last year and $18.7 billion from February last year.
With the index at an all-time high, these longs are sitting on nice gains. Hence the significance of both Charts 1 and 2.
If the 161.8-percent Fibonacci extension poses as resistance – highly likely – and the Russell 2000 comes under decent pressure, non-commercials – trend-followers as they are – will likely think twice before accumulating net longs, possibly tempting IWM/IJR longs to take profits.
Thanks for reading!
