The U.S. sovereign bond market is in upheaval. So to speak.
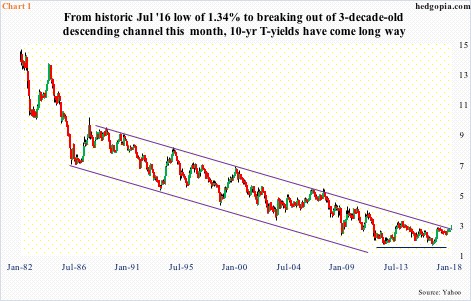
Ten-year Treasury yields have broken out. Chart 1 is a monthly chart. If in the next couple of sessions, these yields stay north of at least 2.5 percent – or thereabouts – they would have broken out on a monthly basis.
This is not going to be any one of those dime-a-dozen breakouts, rather has the potential to be massive. The 10-year has remained trapped within a descending channel for three decades, and it wants to break free.
The fact that 10-year yields have broken out is not as important as its potential implications. The important question is, has this caused – or would this cause – portfolio reallocation?
On January 9th this year, the 10-year broke out of 2.5 percent. On the 10th, yields further rose to 2.6 percent intraday. In that same session, Bill Gross, of Janus Henderson, appeared on Bloomberg Television and said he had gone short on bonds.
Around the same time, Dan Ivascyn. Pimco CIO, said “it remains premature to declare beginnings of bear markets.”
Meanwhile, Jeff Gundlach, of DoubleLine Capital, has for a while been actively tweeting about the upside risk in these yields – rightly so – but hard to tell if he is short. Early last year, he said if the 10-year hit three percent, it would mark the end of the bull market in bonds. At 2.7 percent this Monday, we are nowhere near that.
As far as flows are concerned, there are no signs of massive outflows.
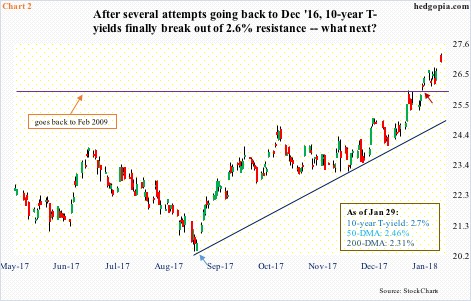
Most recently, 10-year yields bottomed on September 7 last year (blue arrow in Chart 2). Rates were 2.03 percent back then. Monday, they rose to an intraday high of 2.73 percent.
In the week ended September 6 through last Wednesday, U.S. taxable bond funds took in $47.8 billion; ex-ETFs, inflows were $30.1 billion (courtesy of Lipper).
Yields broke out of 2.6 percent on the 18th this month (burgundy arrow in Chart 2). This was a level closely watched by many. Back in December 2016, the 10-year retreated after hitting 2.62 percent, which was unsuccessfully tested again in March last year. Then came the breakout on the 18th. In the couple of weeks through last Wednesday, taxable bond funds still attracted $7.8 billion and ex-ETFs $8.2 billion.
The point is, at least from the standpoint of funds already invested in bonds, there are no signs of dislocation. At least not Yet. But how about other factors?
Just since September 5th last year, two-year yields – most sensitive to the Fed’s monetary policy, or expectations thereof – have risen from 1.27 percent to 2.13 percent. This, along with the rise in long-term yields, will be felt in the economy – sooner or later.
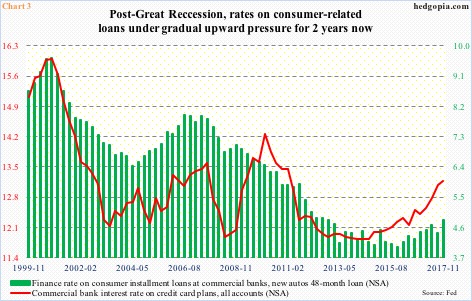
In the past couple of years through November last year, interest rates on 48-month auto loans have risen from four percent to 4.8 percent, and credit-card loans from 12.2 percent to 13.2 percent (Chart 3).
In the current cycle, auto loans have increased from $742 billion to $1.1 trillion (as of 3Q17), and revolving credit from $964 billion to $1.0 trillion (as of November 2017).
This is nothing considering the amount of national debt out there.
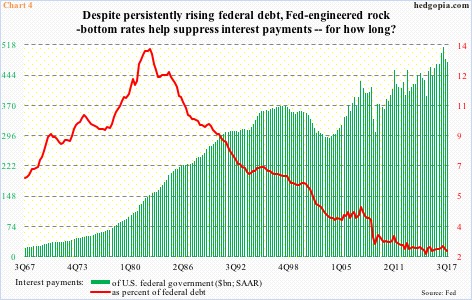
When Great Recession ended in 2Q09, the U.S. federal debt stood at $11.5 trillion. The latest reading is $20.6 trillion. From the perspective of interest payments, this massive increase in the national debt has not mattered much. Back then, annualized payments were $372 billion. In 3Q17, they were $475 billion. This was because the Fed persistently kept the interest rates artificially low. In 2Q09, the federal government was effectively paying an interest rate of 3.2 percent. By 3Q17, this had gone down to 2.4 percent (Chart 4). Suppose rates were flat between the periods, 3Q17 payments would be $652 billion!
Thus the significance of the recent rise in yields, which, if it persists, will be felt across the board – be it government, corporate or individual debt. That is, assuming the current uptrend continues.
Hence the question, how soon before the markets begin to wonder if the U.S. economy – levered as it is – begins to resist higher rates?
Thanks for reading!

