
Major US equity indices staged a massive reversal last Thursday, with more strength Friday. This probably bodes well for bulls near term. For this to translate into medium-term momentum, investors need to embrace risk-on.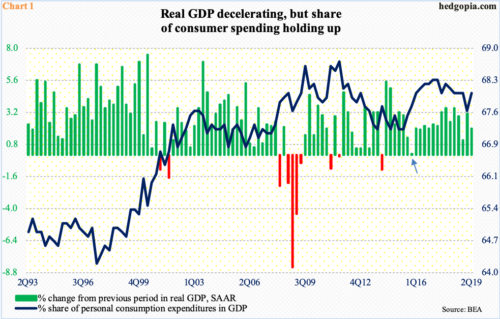
Real GDP growth has softened. Four of the eight quarters between 3Q17 and 2Q19 grew with a three handle. Three of these three-percenters were recorded in 3Q17-2Q18 and only one in 3Q18-2Q19. After 1Q19’s 3.1 percent, the economy decelerated to two percent in 2Q19 (Chart 1). The Atlanta Fed’s GDPNow model forecasts growth of 1.8 percent in the just-concluded 3Q19.
The share of personal consumption expenditures (PCE) – that is, consumer spending – is hanging in there. In 2Q19, PCE’s share in GDP came in at 68 percent, lower than the 68.3 percent in both 1Q17 and 2Q17, but much higher than the 67.2 percent in 1Q15 and 2Q15. Back then, there was growth scare. With growth of 0.1 percent, real GDP came close to contracting in 4Q15.
Making up more than two-thirds of the economy, consumers obviously will have a lot of say in where the economy is headed.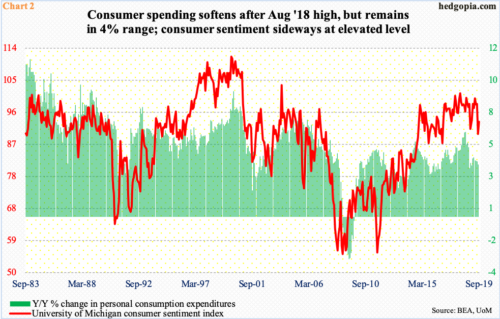
Consumer spending, measured by monthly PCE, grew 3.7 percent in the 12 months to August. This is softer than the 6.1 percent from August last year, but a four-percent clip – or thereabouts – is nothing to sneeze at. Post-Great Recession, spending has grown at an average 3.8 percent.
Historically, consumer spending moves hand in hand with consumer sentiment (Chart 2). The University of Michigan’s consumer sentiment index rose 3.4 points month-over-month in September to 93.2. Except for August’s 89.8, sentiment has been north of 90 since November 2016 – four of them over 100.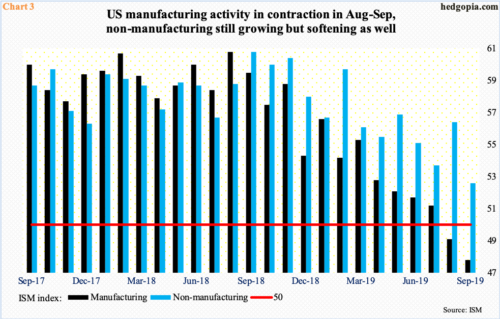
Amidst this came ISM manufacturing and non-manufacturing reports for September last week.
Manufacturing activity fell 1.3 points m/m to 47.8, which was the lowest since June 2009. This was the first back-to-back sub-50 reading since February 2016. Services (non-manufacturing) activity dropped 3.8 points m/m to 52.6 – a 37-month low.
In August last year, the manufacturing index peaked at 60.8. One month later, the non-manufacturing index printed the same reading and headed lower (Chart 3). In essence, both have experienced deceleration in recent months, with manufacturing in contraction territory the past couple of months. The thinking is that this is yet to seep into services. September’s weaker-than-expected services report raises that possibility. One or two more weak reports will have significantly increased the odds. In this scenario, consumer spending takes a hit. By default, this means a hit to the economy.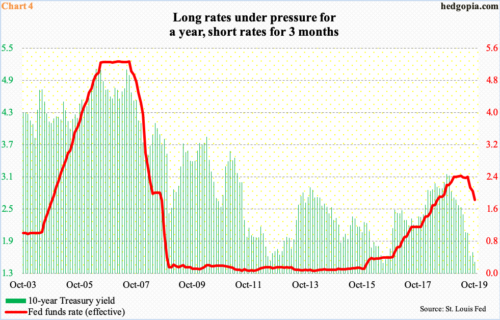
The credit market got rerated last week. The 10-year Treasury yield (1.52 percent) lost 16 basis points. Thursday alone, when the ISM non-manufacturing index was published, rates fell six basis points.
In the short end of the yield curve as well, markets used the weakness in ISM reports to try to force the Fed’s hands. In the futures market Thursday, the probability of a 25-basis-point cut in the fed funds rate later this month rose to north of 90 percent. These odds ended the week at 76 percent after September’s decent jobs report on Friday, but a rate cut is baked in.
The Fed has already eased twice this year – one each in July and September (Chart 4). A cut later this month will put the policy rate at a range of 150 to 175 basis points. The US economy is in its 11th year of expansion. Rates are already so low it is hard to convincingly argue that they will matter in a meaningful manner at this late of a cycle. Nonetheless, at least in theory, lower rates should stimulate more consumer and business borrowing.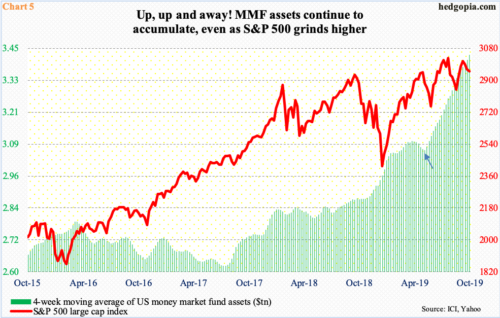
If the recent easing stops the economy from decelerating further, things could potentially evolve similar to 2015-2016. From a 5.5-percent pace in 2Q14, real GDP decelerated to, as mentioned earlier, 0.1 percent in 4Q15 (arrow in Chart 1). Between May 2015 and February 2016, the S&P 500 large cap index dropped more than 15 percent. Equities currently do not anticipate this. Granted it has gone nowhere in the past year, but it is also only 2.6 percent from the all-time high from July this year.
In fact, if – big if – investors sniff stabilization in the economy, equities have more upside risk than downside. There is dry powder.
As of last Wednesday, money-market funds rose $20.2 billion week-over-week to $3.46 trillion – a decade high. Chart 5 uses a four-week average, and it shows the parabolic rise in the green bars the past five months (arrow) regardless how the S&P 500 has performed. Bulls are salivating over the prospects of these assets moving into equities.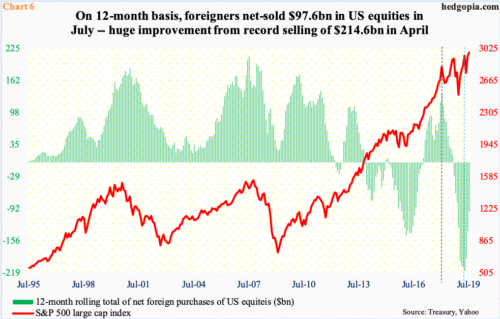
They can take solace from the fact that foreigners are warming up to US stocks. Kind of. In June and July, they purchased $50.6 billion worth. This followed 13 consecutive months of net selling. As a result, the 12-month total peaked in April at minus $214.6 billion – a record (blue vertical line in Chart 6). By July, this was down to minus $97.6 billion.
The green bars are still in the minus column, but directionally they are headed in the right direction. Historically, they correlate well with the red line, which is the S&P 500. Importantly, foreign buying peaked in January last year at $135.6 billion (black vertical line). That is when the index suffered a quick two-week selloff. There have been two more selloffs since, but the S&P 500 has managed to trudge higher. Foreigners, on the other hand, continued to reduce exposure, until recently.
The problem is that this data series comes with a little bit of lag. August’s numbers are due out next week on the 16th. Viewed this way, the signal is hazy at best.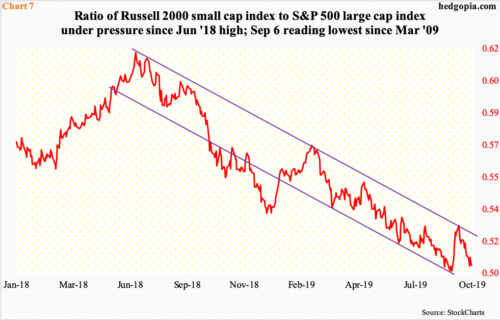
Hence the need to listen to what the collective wisdom of markets are telling us currently. In this sense, it is no risk-on. Not yet anyway.
Chart 7 presents a ratio of the Russell 2000 small cap index to the S&P 500. Typically, investors tend to gravitate toward small-caps when they are in a mood to take on risk. The Russell 2000 (1500.28) peaked in August last year at 1742.09, while the S&P 500 (2952.01) did so in July this year at 3027.98. The ratio between the two peaked in June last year, before persistently making lower highs and lower lows.
On September 6, the ratio dropped to 0.505, which was the lowest since March 2009. The rally since retreated mid-September after kissing the falling trend line in question. Last Friday, the ratio stood at 0.508, lower than Thursday’s 0.510, which in itself was lower than Wednesday’s 0.512. Major stock indices staged a major reversal Thursday, when intraday the S&P 500, for instance, was down 3.6 percent; aggressive buying later in that session as well as Friday turned this into a weekly loss of merely 0.3 percent. Small-caps rallied, too, but underperformed versus large-caps.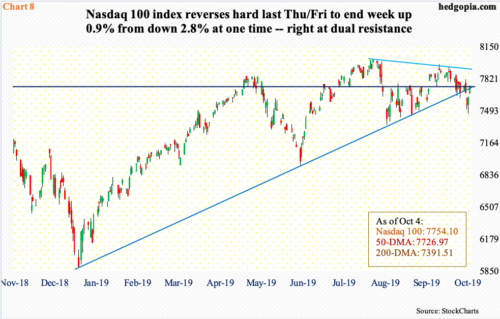
On the other hand, tech outperformed last week. Intraday Thursday, the Nasdaq 100 index (7754.10) was down as much as 2.8 percent for the week. When it was all said and done, it ended up 0.9 percent. Thursday’s low of 7463.57 not only defended August’s lows between 7300 and 7500 but also just about tested the 200-day (7391.51).
Here is the rub. Friday’s 1.5-percent rally was enough to reclaim the 50-day, but not the other two potential roadblocks. There is horizontal resistance at 7750, which also approximates the underside of a broken trend line from last December (Chart 8). Even if this ceiling gives way, another lies at 9925, which is where a falling trend line from late July extends to. The daily has room to continue higher. But for last week’s momentum to continue longer, the sooner signs of risk-on appear, the better.
Thanks for reading!
