
With 2015 now in the annals of history, the message that came out can be described as mixed at best and bearish at worst.
The S&P 500 index fell 0.7 percent last year – essentially flat (Chart 1). The Nasdaq 100 rallied 8.4 percent. The Dow Industrials lost 2.2 percent. And the Russell 2000 index declined 5.7 percent.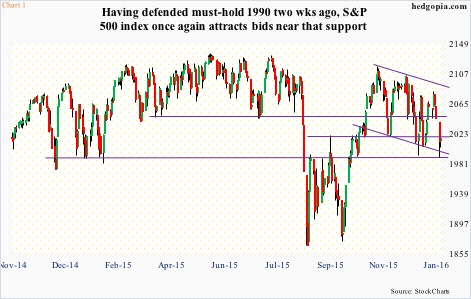
Depending on one’s choice of index, stocks were either up, down, or flat. In other words, mixed.
But was it really mixed or does an amalgam of evidence lean bearish?
If we focus on the Nasdaq 100 – or for that matter the Nasdaq composite, which was up 5.7 percent – the picture begins to clear up a little. Primarily, behind the outperformance probably lies a four-letter acronym – FANG.
In 2015, Facebook (FB) rallied 34 percent, Amazon (AMZN) 118 percent, Netflix (NFLX) 134 percent, and Alphabet (GOOGL, formerly Google) 47 percent.
In the Nasdaq 100 (Chart 2), these four names have respective weights of 4.3 percent, 5.5 percent, 0.9 percent, and 4.6 percent. At 12.9 percent, the largest weight goes to Apple (AAPL), which lost three percent last year.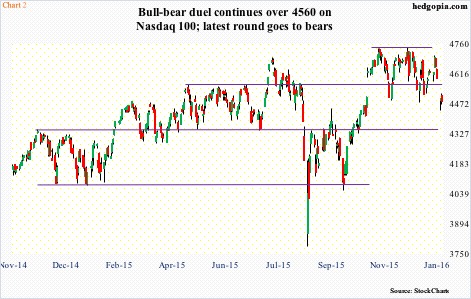
In other words, tech-heavy indices’ performance was very narrow. Not healthy, come to think of it. With this as a backdrop, it is hard to imagine FANG – particularly AMZN and NFLX – repeat their performance this year.
Viewed this way, tech’s leadership last year needs to be taken with a grain of salt. In the aggregate, stocks underperformed. The NYSE composite was down north of six percent.
As a matter of fact, stocks struggled right off the bat in 2015. January was down 3.1 percent. The first three sessions were down 2.7 percent.
This year has not gotten off to a good start either, with the S&P 500 down 1.3 percent in the first couple of sessions.
The bull market, set to complete seven years in two months, is beginning to show its age. The U.S. economy, which in six months would have expanded for seven years, is maturing as well.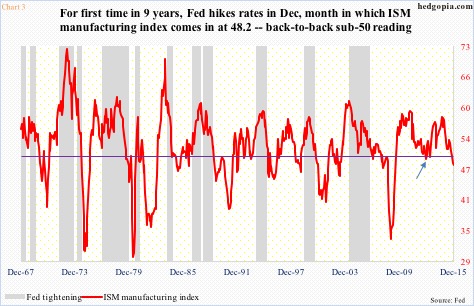
We just had a first back-to-back sub-50 reading in the ISM manufacturing index in the current expansion. The last time this took place was more than six years ago. Back then, the index remained under 50 in 18 out of 20 months between December 2007 and July 2009.
The obvious question that comes to mind is, is the current manufacturing weakness the beginning of something serious or more like a one-month blip in November 2012 (arrow in Chart 3)? We know this much. The economy since that sub-50 reading is three more years into expansion, hence would have trouble rebounding with the same vigor.
Nowhere is this better reflected than in earnings. The cycle has peaked. With 4Q15 yet to be reported, operating earnings of S&P 500 companies for 2015 are now estimated at $106.38. First, this was down from $113.02 in 2014. Second, estimates were as high as $137.50 at the end of 2Q14! This year’s estimates, currently $125.56, have been coming down as well, but will need to grow 18 percent to be realized (Chart 4). Possible, but not probable.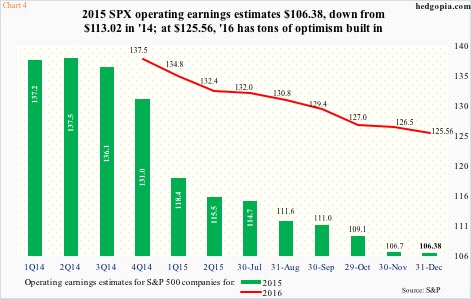
Even at what looks like lofty 2016 estimates, the S&P 500 trades at 16 times this year’s operating earnings. Not cheap, especially so considering that flows are anything but cooperating.
For the first time in five weeks, U.S.-based equity funds attracted $10 billion in the week ended last Wednesday (courtesy of Lipper) – first inflows in five weeks, and after $30.3 billion having left in the prior four. Since September 30th, a total of $8.6 billion has left these funds. The S&P 500 index bottomed on September 29th.
With all these headwinds – existing and potential – the S&P 500 is off just north of five percent off the highs. Kudos to the bulls. Medium- to long-term, the risk is that the index comes under substantial pressure as the year progresses. The reward is a retest of the May 2015 highs. Risk-reward favors the former.
In the near-term, though, a lot is going to depend on what happens on/around crucial support.
So far, on the S&P 500 in particular, signs are encouraging.
The index has been trapped within a descending channel for over two months now. This Monday, it kissed the bottom end of that. Buyers showed up. Incidentally, that was near must-hold support at 1990 (Chart 1). Since the middle of December, that level has been defended twice.
The Nasdaq 100 has lost – once again – 4560 (Chart 2). But the 200-day moving average has been defended. Apple (AAPL) remains grossly oversold on a daily chart, but has lost crucial support at $105-plus.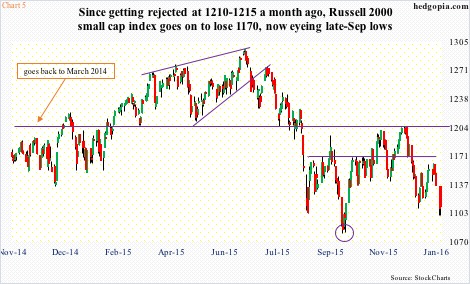
The Russell 2000 is the weakest of the bunch. Along with the S&P 400 mid-cap index, it was one of the major U.S. indices to have undercut August lows in September (circle in Chart 5). A rally attempt was rejected hard early last month at the 1210-1215 March 2014 resistance, with weakness since. At worst, it is headed toward September lows. The next few sessions will be crucial.
Amidst all this, it is worth pointing out that the S&P 500 just had a weekly bearish MACD crossover. Once again, medium- to long-term remains a concern.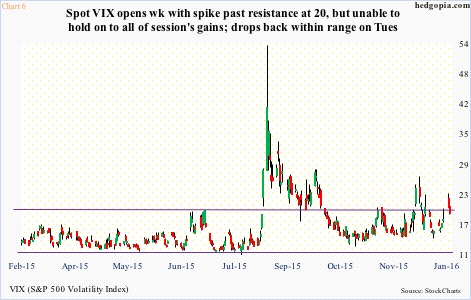
Near-term, the best signal can come from spot VIX as to which way things might be headed. Just in the middle of December when the S&P 500 was testing 1990, VIX surged to nearly 27, before reversing. That set off a nice countertrend rally in the S&P 500. On Monday, VIX closed up 2.49 points, but at one point was up as much as 5.15. This was followed by a dip below 20 on Tuesday (Chart 6). If past is prologue, a VIX spike followed by a reversal tends to favor stocks – duration notwithstanding.
This is a good opportunity for equity bulls near-term. Inability to cash in on this only exposes their vulnerability.
Thanks for reading!
