Last Wednesday, speaking to the Wall Street Journal President Trump said that the dollar was getting too strong and that it would eventually hurt the U.S. economy. In the past, he, as well as Treasury Secretary Steven Mnuchin, have made similar remarks. The Administration is less than three months old.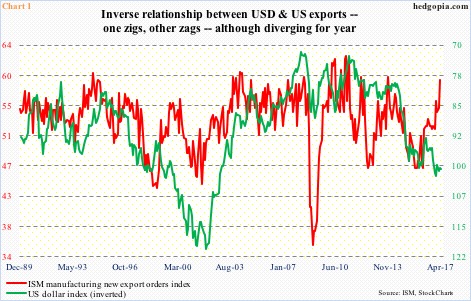
Trade is one of the issues on Mr. Trump’s agenda. He wants to reduce the trade deficit. A strong dollar is not conducive to that goal.
Chart 1 pits the ISM manufacturing export orders index against the US dollar index. The latter is inverted. The two do tend to move together, although they have diverged in the past year.
The dollar index (100.46) bottomed last May at 91.86 and rose as high as 103.82 early January. Among others, it is responding to movement in interest rates.
After lowering the fed funds rate to near zero in December 2008, the Fed kept it there until December 2015, when it raised by 25 basis points to 0.37 percent. With two more hikes since – December last year and March this year – the fed funds rate stands at 0.91 percent.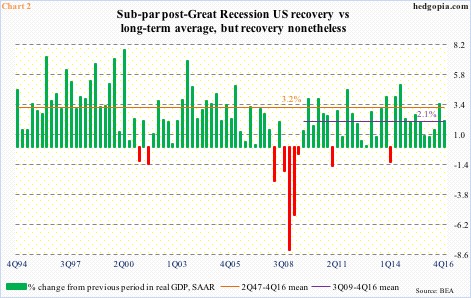
In that same interview, Mr. Trump said he would like to see interest rates stay low. This is a 360 from his earlier position. During the campaign, he was critical of the Fed’s easy monetary policy, saying rates were too low.
He had a point.
The U.S. economy is just a few months from completing eight years of recovery (Chart 2). Yes, growth is subdued – averaging 2.1 percent rise in real GDP since 3Q09 versus the long-term average of 3.2 percent – but it is recovery nonetheless (Chart 2).
One impact of highly accommodative monetary policy is seen in asset inflation – from stocks to real estate to the arts.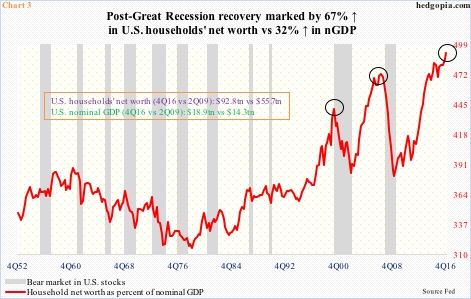
In fact, the March 14-15 FOMC minutes showed that members discussed stretched equity valuations.
Using trailing 12 months, the S&P 500 large cap index traded at 21x operating earnings at the end of 2016. On elevated 2017 and 2018 estimates, this improves to 18x and 16x, respectively, but still not cheap.
Chart 3 is another example. As a percent of nominal GDP, U.S. households’ net worth jumped to a new high in 4Q16 – past prior peaks of 1Q00 and 1Q07. The growth in net worth post-Great Recession is lop-sided, to say the least.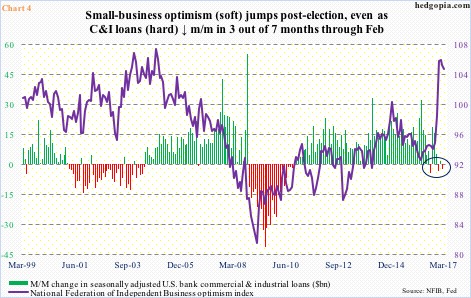
Beginning early March, there has been a decided shift in the Fed’s hawkishness – planning to not only throw in at least a couple more hikes this year but also begin a process of balance-sheet normalization.
Enter last week’s interview.
If you want a weak dollar, you cannot be vouching for a tighter monetary policy. Besides his interest-rate comments, Mr. Trump also said he is open to renominate Ms. Yellen but has not made up his mind (her term expires next January).
A carrot has been dangled in front of her.
Would she be tempted to put off her rate-hike plans for at least until she gets the renomination nod? Tough to say. But, should she so desire, data are likely to come to her rescue.
Despite a sharp post-election jump in several soft data, this is yet to translate into hard data. The Atlanta Fed’s GDPNow model currently forecasts 0.5-percent growth in 1Q17 real GDP.
The NFIB small business optimism index surged 11 points between last October and January to a 13-year high before softening a little. Banks’ commercial and industrial loans, on the other hand, have been decelerating – down month-over-month in three out of seven months through February (Chart 4).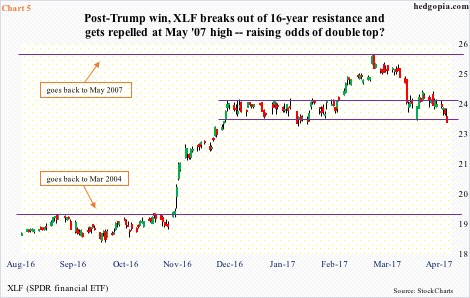
How the Fed behaves next is bound to reverberate through a whole host of assets, not the least of which are financials.
XLF, the SPDR financial ETF, massively broke out post-election, up 27 percent through the high on March 2 – pricing in higher rates and a steeper yield curve.
Rates on the short end did indeed rise, with two-year yields rallying from 0.8 percent to 1.4 percent on March 14 (the Fed hiked on the 15th). But the long end lagged, with 10-year yields not able to break out of 2.62 percent. As a result, the yield curve narrowed – from 134 basis points on December 21 last year to 103 basis points.
Banks borrow short and lend long. They would like a wider spread, not narrower.
Since the March 2nd peak ($25.21), XLF has trended lower. This may prove to be an important top, as it unsuccessfully tested the prior high of $25.31 in May 2007, raising odds of a double top.
A sentiment shift is occurring.
Near-term, if the ETF ($22.90) manages to rally, $23.70 is where there is likely to be a tug of war between bulls and bears. Should the latter succeed, it will be confirmation that markets expect a less-hawkish Fed.
Thanks for reading!

