
Last week, the S&P 500 as well as the Nasdaq 100 started out strong but finished poorly. The Russell 2000, on the other hand, stayed strong, closing near the week’s high. Before one interprets this as markets’ way of telling traders to take on risk, the Russell 2000 (1539) needs to first break out of 1600+.
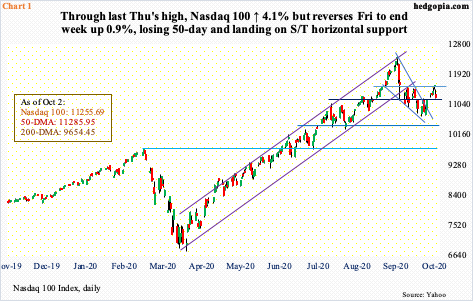
At one time last week, the Nasdaq 100 was up 4.1 percent. When it was all said and done, it closed the week up 0.9 percent. The S&P 500 large cap index similarly was up 1.5 percent versus up three percent at one time. The Russell 2000 small cap index, in contrast, jumped 4.4 percent. For the underperforming indices, Friday’s trading made a big difference, with the S&P 500 down one percent and the Nasdaq 100 down 2.8 percent.
The Nasdaq 100, in particular, gapped up Monday to retake the 50-day (11285.95). Before this, the index (11255.69) stayed under the average for seven consecutive sessions, which was an opportunity for bears, but bulls quickly defended 10700s, well above decent support at 10300-10400 (Chart 1). The rally that followed culminated in Thursday’s intraday high of 11606.73, where sellers showed up. There was short-term straight-line resistance at 10500-10600, and it held. Friday’s renewed selling brought the index back below the 50-day – albeit slightly – with a weekly shooting star to boot.
Tech bulls can draw solace in the fact that the Nasdaq 100 landed right on straight-line support last week, which also approximates both the 10- and 20-day.
Small-cap companies inherently have larger exposure to the domestic economy, versus their larger-cap cousins who also have international exposure. The conventional wisdom holds that investors gravitate toward these stocks when they believe good times lie ahead in the US economy, leading to willingness to take on risk.
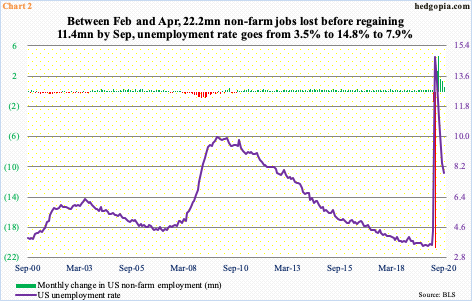
The Russell 2000’s 0.5-percent rally last Friday amidst a sea of red came in a jobs day. The economy added 661,000 non-farm jobs in September, to 141.7 million. This was less than expected but represents progress in that since the April low 11.4 million jobs have been created. Of course, between February’s record high 152.5 million and April, 22.2 million were lost. Like that! To get some perspective how atypical this is, in the previous expansion lasting 128 months 21.5 million jobs had been created.
Despite the progress in the last five months, the economy needs to create nearly 11 million more jobs to get to the pre-Covid 19 recession high. The unemployment rate similarly was 3.5 percent in February, 14.8 percent in April and 7.9 percent in September (Chart 2).
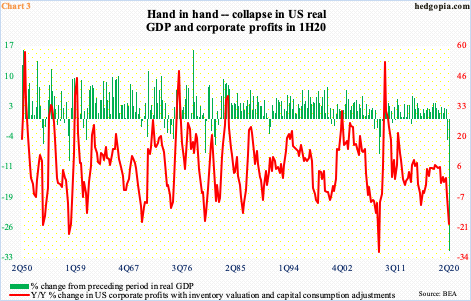
Because the hit to the economy was so sudden and severe that it also raises the possibility that it cannot get any worse. Real GDP, for instance, is expected to snap back sharply in 3Q; the Atlanta Fed’s GDPNow model is forecasting 34.6-percent growth. This preceded a 31.4-percent contraction in 2Q and a five-percent decline before that. This was the first back-to-back contraction since 2Q09.
Corporate profits, which tend to go hand in hand with GDP, have had their share of pain as well (Chart 3). In 2Q, profits after inventory valuation and capital consumption adjustments tumbled 19.3 percent year-over-year and 6.7 percent before that. Profits were $1.83 trillion in 2Q, down from record $2.31 trillion in 4Q19; real GDP during that period was $17.30 trillion and $19.25 trillion, in that order.
At least going by the consensus, next year is expected to be different – a lot better.
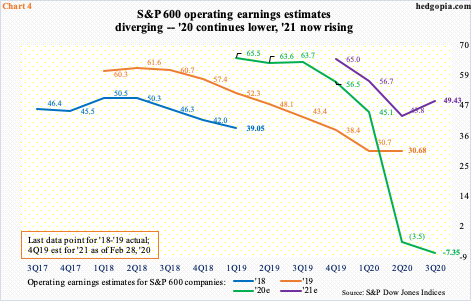
Take operating earnings estimates for S&P 600 small cap companies (Chart 4). As of last Tuesday, the sell-side expected $49.43 next year. Granted they had penciled in $64.96 in February this year, but estimates have trended higher since bottoming at $42.99 as of July 16th.
Next year’s estimates are revised higher even as this year’s kept going lower. The latest estimate for this year is a loss of $7.35, which is slightly better than a loss of $8.35 expected less than a week before that. In February last year, these analysts were expecting $67.63 for this year – and over $57 in January this year.
This year’s downward revision trend is affirmation why it is risky to always take these estimates at face value. It is three more months before 2021 even begins. Traditionally, the sell-side is notorious for starting out optimistic and then gradually lower their numbers as the year progresses.
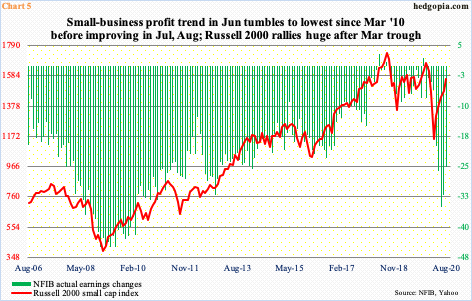
If next year’s estimates come through, this will have represented quite a U-turn from this year’s profit trend. Besides what is portrayed in Chart 4, the NFIB’s ‘actual earnings changes’ sub-index also shows the deterioration in small-cap earnings this year.
In May 2018, the green bars in Chart 5 hit three – an all-time high. Incidentally, the Russell 2000 peaked in August that year. Up until last November, the sub-index read two. The bottom fell out in April this year when it fell 14 points month-over-month to minus 20; two months later, it hit minus 35, which was the lowest since March 2010, before recovering the next two months (Chart 5). The Russell 2000 anticipated this by bottoming late March. How the index behaves going forward is markets’ way of telling us how small-cap profit trend might evolve.
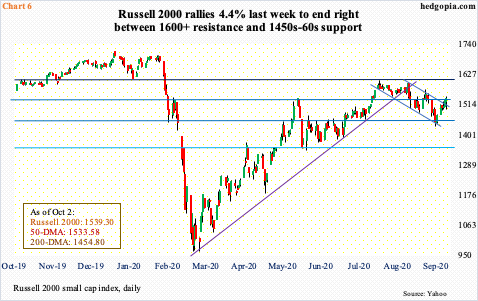
Since January 2018, just north of 1600 has proven to be a crucial price point on the Russell 2000. Small-cap bulls last lost this level late February, before dropping all the way to 960s in the second half of March. After that trough, it took the index nearly five months before 1600-plus was tested, which took place early August, and it was denied (Chart 6).
Early September, bulls once again rallied the index into 1590s, and once again sellers were active in that area. Soon afterwards, a rising trend line from the March low was breached. By late September, horizontal support at 1450s-60s was tested – this time successfully. Off of that low, the index (1539.30) has rallied right into its 50-day at 1533.58. This area also has decent straight-line resistance and is situated right between 1600-plus and 1450s-60s. A break either way has the potential to carry the near-term momentum. But until bulls are able to decisively take out 1600-plus, this will be nothing more than choppy, range-bound behavior. For a convincingly positive message to come through as relates to the economy and earnings next year, 1600+ needs to fall.
Thanks for reading!
