
It is probably a foregone conclusion that the Fed later today leaves interest rates unchanged, and will announce a plan to gradually shrink its massive portfolio of mortgage and Treasury bonds.
The question is, how would the markets react? The bigger question is, is this going to be a smooth ride, or, better yet, how long before the Fed possibly reverses it?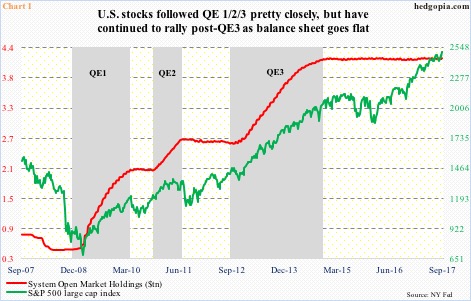
Back in December 2008, the Fed’s System Open Market Account (SOMA) holdings were $482 billion. In the week ended Wednesday last week, they were $4.2 trillion, of which $1.8 trillion was in mortgage-backed securities and $2.3 trillion in Treasury notes and bonds. Three iterations of quantitative easing, which lasted from December 2008 through October 2014, inflated SOMA holdings to $4.2 trillion (and the balance sheet to $4.5 trillion).
Equities loved this (Chart 1).
In fact, as soon as QE1 ended, U.S. stocks threw a tantrum, and got back in rally mode once QE2 got underway. The pattern repeated itself as QE2 came to an end.
That said, stocks did not fall apart post-completion of QE3, subsequent to which the S&P 500 large cap index traded within a wide range, until it broke out in July last year.
One explanation for this divergence: QE did end three years ago, but the Fed continues to reinvest the proceeds from those bonds and roll them over. The balance sheet has gone sideways.
Now, the plan is to begin to shrink it.
Logically, if balance-sheet expansion helped stocks, a reduction should begin to hurt. Put differently, when QE was initiated, the message to investors was to get on the risk curve. Now that the Fed wants to unwind the balance sheet, what is the message – get off the risk curve?
Concurrently, the ECB and the BoJ are still active in asset purchases. Even here, the ECB has curtailed its monthly purchases from €80 billion/month to €60 billion, and is likely to cut back more. It is running out of qualified assets to purchase. Ditto with the BoJ, hence its decision to target the yield curve.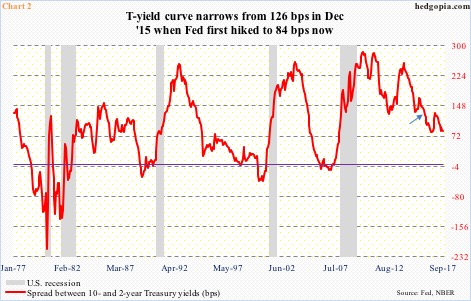
The other issue is, what will be the impact on the yield curve?
In 2013, post-taper tantrum, 10-year yields shot up from a low of 1.61 percent in May to just north of three percent by December.
This time around, into the FOMC meeting, 10-year yields rallied from 2.03 percent eight sessions ago to 2.24 percent.
Nonetheless, since the Fed started raising the fed funds rate in December 2015 (arrow in Chart 2), the yield curve (10s/2s) has narrowed, with 10-year yields essentially sideways between 2.29 percent on December 16 that year and 2.24 percent now, even as the two-year went from 1.02 percent to 1.4 percent. The spread has narrowed from 127 basis points to 84 basis points.
The ongoing policy of reinvesting the proceeds in Treasury notes and bonds must be distorting the long end of the curve. Alternatively, the curve is warning about the impact of higher rates on a leveraged economy. The fed funds rate has gone up by 100 basis points since December 2015.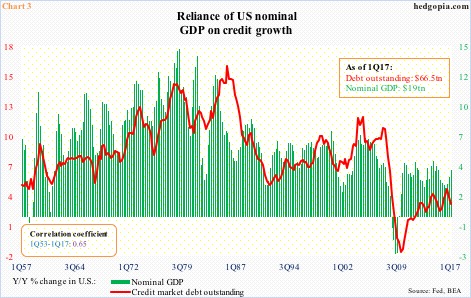
The reliance of the U.S. economy on leverage needs no elaboration.
Directionally, total debt outstanding and nominal GDP move together. In Chart 3, data is as of 1Q17. (The Fed’s Z.1 flow of funds report for the second quarter will be published Thursday.)
The federal debt just crossed $20 trillion – $20.2 trillion currently. With nominal GDP of $19.2 trillion in 2Q17, the debt-to-GDP ratio has been north of one for 19 straight quarters.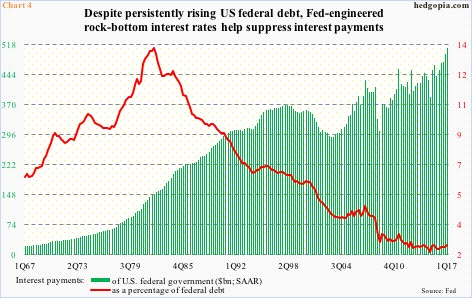
Therein lies the rub.
In 1Q17, federal interest payments were $508.9 billion (seasonally adjusted annual rate). This equaled 2.56 percent of the debt load.
Post-Great Recession, federal debt went up by $8.3 trillion (as of 1Q17). Back then, the government was paying an effective interest rate of 3.22 percent.
Interest rates remain suppressed, thanks to the Fed. Simplistically, if we assume effective rates go up by 100 basis points from the 1Q17 level, interest payments would increase by north of $200 billion, to $719 billion.
The debt load – and rising – is a clear deterrent.
Rates are not in a position to come under sustained upward pressure. Leverage would not allow it, and the economy cannot handle it. If the Fed’s planned unwinding of the balance sheet ends up causing that, it will have to reverse it – sooner or later.
Thanks for reading!
