
That the green line in Chart 1 is increasingly taking the form of a coiled spring is non-debatable. That the longer it stays compressed in oversold territory, the higher the odds of a spike higher is non-debatable. What is debatable is how soon this might occur.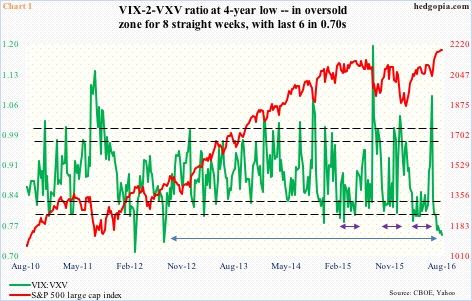
Last Friday, VIX:VXV closed at .75 – the lowest in four years. The ratio has been stuck in mid- to high-.70s in the last six weeks, and in low- to mid-.80s in two weeks before that. Sideways moves of this duration do not occur that often.
In the past year and a half, there have been three occasions in which the ratio stayed oversold for extended periods (smaller bi-directional arrows Chart 1). The latest – from mid-March to end-May this year – lasted 12 weeks, then surging from .82 to 1.08 in three weeks.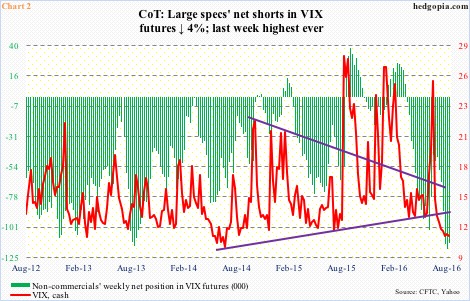
A similar phenomenon can be seen in Chart 2, which plots non-commercials’ net position in VIX futures. In the week ended August 9th, net shorts, at 118,817 contracts, were a record. Last Tuesday, they fell four percent week-over-week but remains massive.
In the meantime, spot VIX continues to languish in 11-12, remains grossly oversold, and is at the bottom end of a multi-year range. The heavy net shorts in Chart 2 potentially is a squeeze waiting to happen. Once again, the question is, how soon?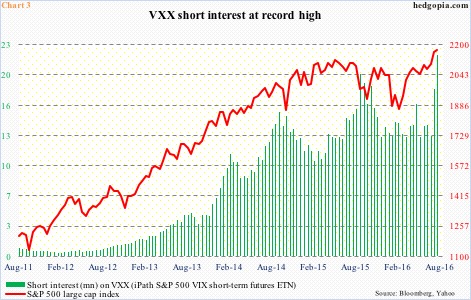
Should spot VIX begin to come under upward pressure, taking VXX, the iPath S&P 500 VIX short-term futures ETN, along with it, there is huge potential for a squeeze. In the latest period – July 29th – short interest on VXX jumped 20.1 percent period-over-period to 21.9 million, a new high (Chart 3). In the past month, short interest has shot up 67.9 percent! The aggression jibes with the one seen in the futures market.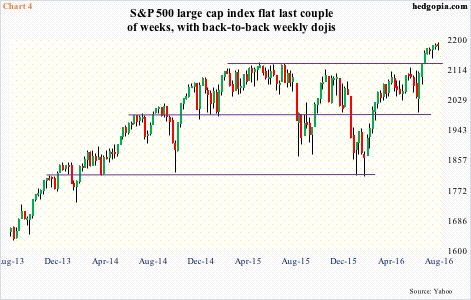
When the VIX-to-VXV ratio first entered oversold territory in the June 27th week – that was the week after Brexit – the S&P 500 large cap index was more than 100 points lower. Now, with a 10-percent rally since that low, signs of fatigue are showing up left and right.
The index has pretty much been going sideways for a month now, shortly after it broke out past the all-time high of May 2015 (Chart 4). The grind higher has fatigue written all over. In the past couple of weeks, it has gone nowhere, with weekly dojis.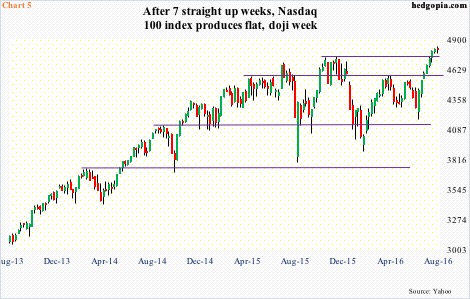
Over on the Nasdaq 100, last week produced a similar candle. After seven straight up weeks, during which the index rallied nearly 16 percent to an all-time high, last week was flat as a pancake, and a doji to boot (Chart 5). Both 10- and 20-day moving averages are no longer rising steeply – either slightly rising or beginning to go flat. Rather interestingly, the 200-day moving average is beginning to go flat as well.
Incidentally, in the last couple of weeks the Nasdaq 100 rallied 0.3 percent. In the prior two, it jumped 2.7 percent. The rate of change is decelerating. Money is still flowing, with QQQ, the Nasdaq 100 ETF, attracting $874 million in the last two weeks, and $2 billion in the prior two (courtesy of ETF.com).
Similarly, as of last Tuesday, non-commercials had built up 127,946 contracts in net longs in Nasdaq 100 index (mini) futures. Holdings are down slightly from 131,679 contracts two weeks ago, but those were the highest since November 2013. The point is, these traders can grow impatient the longer the Nasdaq 100 goes sideways to down.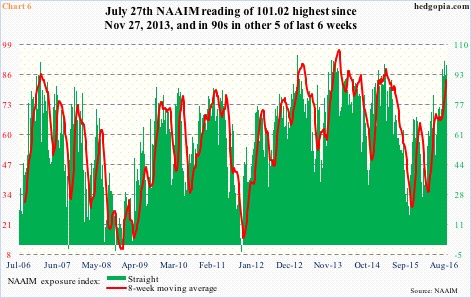
Indices are showing signs of fatigue even as investors have pushed their chips – at least a good majority – to the center of the table.
The National Association of Active Investment Managers puts out a weekly index showing members’ average exposure to U.S. equity markets. In the week ended last Wednesday, this stood at 98.79, up from 92.86 week-over-week. The index has been in 90s and above in the last six weeks, with a reading of 101.02 in the week ended July 27th. This was the highest since November 27, 2013. Since July 2006, there have been four other times it has exceeded 100. That is how rare it is (Chart 6).
For the most part, the rally since June 27th – or February 11th, for that matter – is technical- or momentum-based, not so much fundamentals. In the first seven months this year, non-farm payroll averaged monthly growth of 186,000, versus 229,000 in 2015 and 251,000 in 2014. Real GDP grew a mere 1.2 percent in 2Q16, and even weaker 0.9 percent in 4Q15 and 0.8 percent 1Q16.
Inventory is the wild card.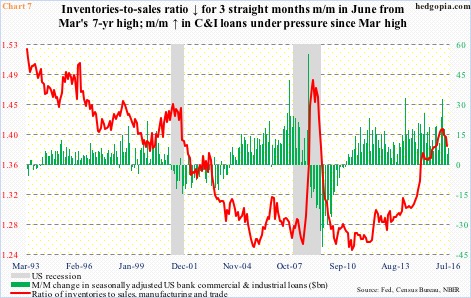
The inventories-to-sales ratio in Chart 7 can drop by either the numerator rising slower than the denominator or the latter growing faster than the former. Since the ratio peaked at 1.412 in March this year, it has been the latter. But the fact remains that at a seasonally adjusted annual rate of $1.81 trillion in June, manufacturing and trade inventory remains elevated.
Inventory reduction subtracted from real GDP growth in the last five quarters. The Atlanta Fed’s GDPNow forecast for real GDP growth in 3Q16 is tracking at 3.6 percent, but if the trend in inventory reduction continues – which is one way the red line can continue lower – growth suffers. The trend in banks’ commercial & industrial loans has definitely softened in recent months (Chart 7).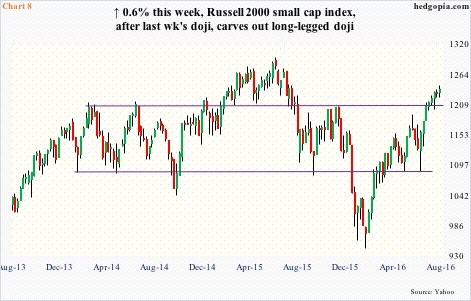
Is this the reason why the Russell 2000 small cap index is yet to surpass old highs? Small-caps inherently have sole/high exposure to the domestic economy. In June last year, the index made an all-time high, which still holds (Chart 8).
Off the February lows, the Russell 2000 has rallied nearly 32 percent, and north of 14 percent since the June 27th post-Brexit low. This was enough to push it past resistance going back to March 2014, but not for a new high. Saving this recent breakout is likely to prove difficult. Last week’s spinning top came on the heels of a dojj before that. Sign of indecision/fatigue on yet another major U.S. equity index.
Thanks for reading!
