
Economic data are coming in mixed after recent lows. In the aggregate, there is no V as far as the economy is concerned. In contrast, the S&P 500 completed a perfect V, which came about over six months. As things stand, if the Russell 2000 is able to decisively break out of 1600-plus is more important than how the S&P 500 behaves.
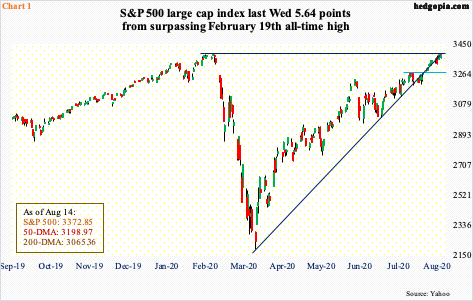
The S&P 500 large cap index has charted out a perfect V-shaped recovery. From 3393.52 on February 19 to 2191.86 on March 23 to last Wednesday’s high of 3387.89, it completed a round trip in six months (Chart 1). In other words, last week’s high was merely 5.64 points from posting a new high.
Along the way, the February-March selloff cost one after another support, even as the recovery post-March bottom gradually reclaimed all that, and then some. Should February’s high be eclipsed, it will be interesting to see if that resistance immediately turns into support. This is how things have evolved since the March bottom; bulls obviously would like this streak to continue.
As the S&P 500 (3372.85) is hammering on its prior high, bulls and bears are increasingly acting undecided. Last week, Monday started with a hanging man, followed by Tuesday’s outside day. The index rallied 1.4 percent Wednesday, but this was followed by a doji each on Thursday and Friday.
Bulls hope a new high, which is looking imminent, helps change this.
A V shape in the S&P 500 is not complemented by a V-shaped recovery in the US economy. As is the case normally, markets are looking ahead and pricing in a sharp recovery. Thus far, there is no uniformity in how macro data have improved from recent lows.
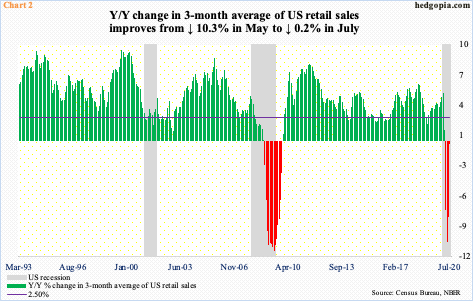
Take retail sales. In January, they rose to a seasonally adjusted annual rate of $529.6 billion, which was a new high. Then the Covid-19 hit. By April, sales bottomed at $412.8 billion, making way for July’s $536 billion – a new record. From this standpoint, it is a V.
If we smooth out the monthly volatility by taking a three-month average, we get a slightly different picture. On that basis, retail sales fell 10.3 percent year-over-year in May. June and July improved, but the latter was still down 0.2 percent.
Of course, should the momentum continue in the months to come, it is just a matter of time before the red bars on the right side of Chart 2 turn green.
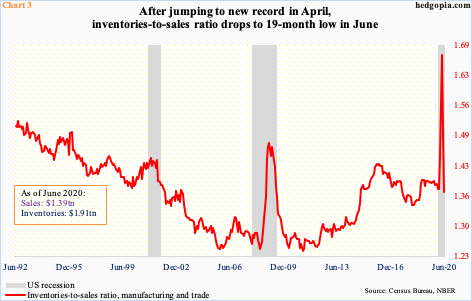
One thing favoring V-shape proponents is subdued inventory buildup.
The inventories-to-sales ratio in manufacturing and trade dropped to 1.372 in June. This was a 19-month low. Of course, this preceded April’s record 1.671. It sure looks like an inverted V (Chart 3).
Elsewhere, the ISM inventories sub-index in manufacturing dropped 3.5 points month-over-month in July to 47. Orders, on the other hand, jumped 5.1 points to 61.5. As a result, the orders-inventories spread was at a 32-month high (not shown here).
Depending on how soon a Covid-19 vaccine is found, inventory accumulation itself can give a nice push to the economy, not to mention a jump in end-demand.
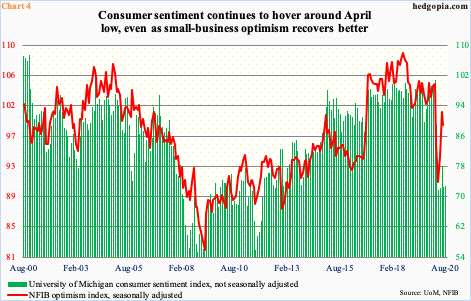
This scenario is what equities are increasingly pricing in. Consumers, on the other hand, are not as gung-ho.
Preliminarily, the University of Michigan’s consumer sentiment index in August rose three-tenths of a point m/m to 72.8. This is just a point higher from the April low of 71.8. Earlier, sentiment began dropping after February’s 101. After April’s bottom, it did reach 78.1 in June, but not before dropping the very next month near the April low.
Small-business optimism similarly jumped nicely from April’s 90.9, but July was down 1.8 points m/m to 98.8. That said, unlike consumer sentiment, the NFIB optimism index is substantially off the April low.
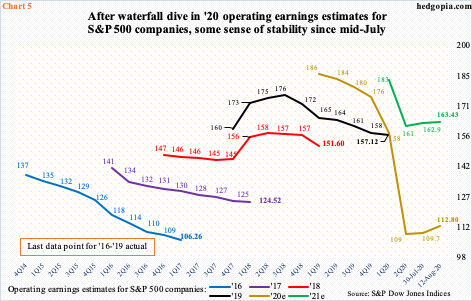
To make matters even muddier, large-cap earnings expectations seem to be stabilizing. At least they have done so in the past month.
This year’s operating earnings estimates for S&P 500 companies bottomed at $108.86 on July 8, as 2Q earnings season was just getting under way. As companies began reporting, blended estimates progressively improved to $112.80 as of last Wednesday (Chart 5). Estimates for next year similarly bottomed at $160.89 on July 16 and were $163.43 last Wednesday.
Amid this one-month stability, the fact remains that both ’20 and ’21 underwent substantial downward revision. In March last year, ‘20 was expected to bring in $186.36, while ’21 was $183.37 in March this year.
With 90 percent reporting, the way 2Q has fared, bulls have probably gotten more optimistic about the second half, which is expected to account for just under 60 percent of this year’s earnings.
Last Wednesday, 2Q blended estimates reached $26.08, up from $22.37 on July 8.
The recent improvement in revision trend does not hold true for mid- and small-caps – the latter in particular. Operating earnings estimates for S&P 600 companies this year stood at -$7.72 last Wednesday. In February last year, the sell-side expected $67.63! Estimates turned negative in the last week of June and persistently worsened.
This is an important data point and captures the ongoing deterioration in small-business earnings. These are the businesses most exposed to the domestic economy.
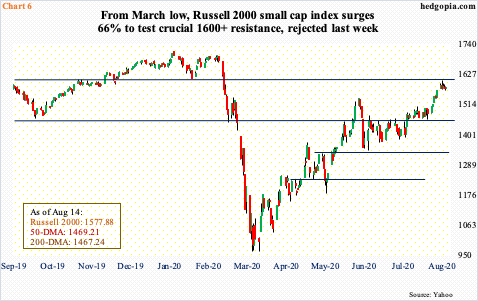
As far as the collective wisdom of markets is concerned, things have reached a crucial spot. Going back to January 2018, just north of 1600 has proven significant. This level was last lost in the February selloff. After the February-March collapse stopped on March 18 at 966.22, the Russell 2000 small cap index rallied past one after another resistance. Last month, 1450s-60s fell.
After hugging 1450s-60s for more than two weeks, the index (1577.88) began to pull away as soon as August began. Last week, bulls aggressively went after 1600-plus, with three of the five sessions hitting 1590s; Tuesday, 1603.30 was tagged intraday before sellers came out of the woodwork to finish the session at 1575.10 (Chart 6).
A decisive 1600-plus breakout could mean those believing in small-business revival, which then translates to improvement in the whole economy, are winning over the pessimists. As things stand, its message would be heard louder than how the S&P 500 behaves, should it occur.
Thanks for reading!
