
After strong rallies the past couple of weeks, major US equity indices have reached crucial levels, particularly the S&P 500, even as the Russell 2000 fails at a breakdown backtest and VIX sits at the 200-day.
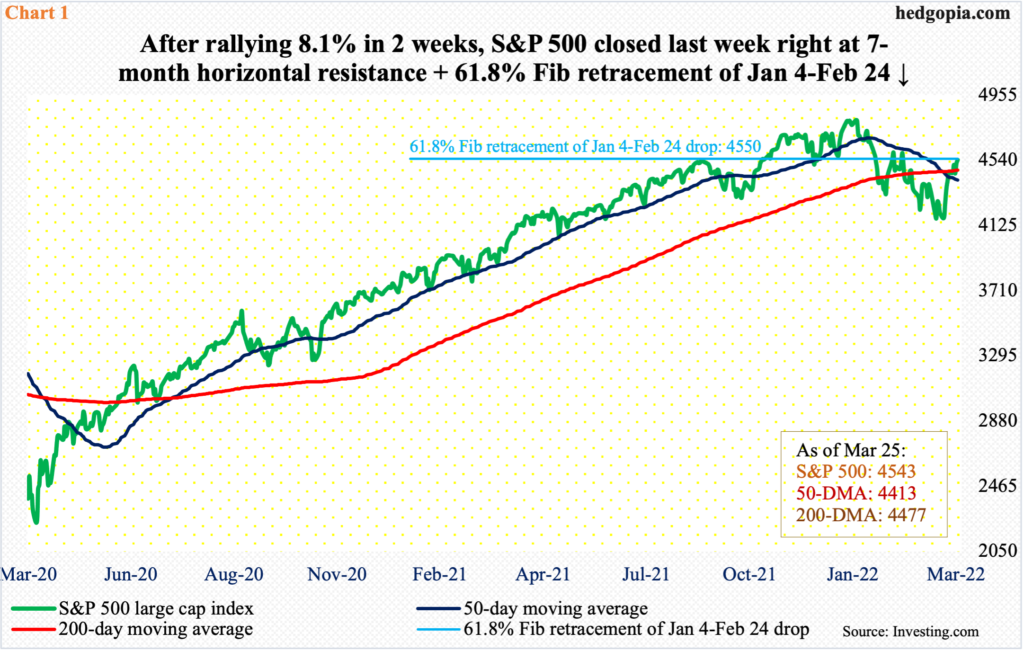
The S&P 500 (4543) rallied 8.1 percent in the last couple of weeks, including last week’s 1.8 percent. This preceded a 14.6-percent drop between the January 4 record high of 4819 and the February 24 low of 4115. A 61.8-percent Fibonacci retracement of this drop lies at 4550 (Chart 1). This level also represents horizontal resistance going back to last August. Shorts could get tempted here.
The daily is extended. Bulls, however, would have improved their odds should they be able to absorb the potential offers. In the week to Wednesday, $11.3 billion moved into US-based equity funds (courtesy of Lipper), even as SPY (SPDR S&P 500 ETF), VOO (Vanguard S&P 500 ETF) and IVV (iShares Core S&P 500 ETF) took in $5.7 billion (courtesy of ETF.com).
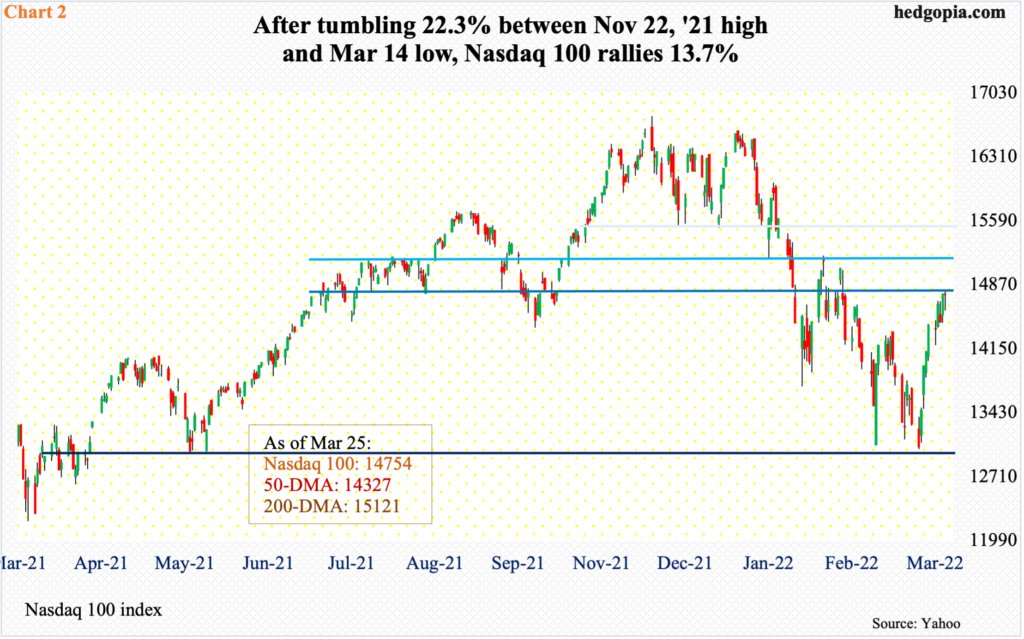
The Nasdaq 100 similarly rallied 10.9 percent in the last couple of weeks. This comes after a 22.3-percent decline between November 8 last year and March 14. That low was a successful test of the low of last May (Chart 2).
Unlike the S&P 500 which has reclaimed both the 50- and 200-day moving averages, the tech-heavy index lies between the two. Last week, the Nasdaq 100 closed at 14754, which could provide resistance. A takeout of this level opens the door toward the 200-day at 15121, which also approximates horizontal resistance at 15100s.
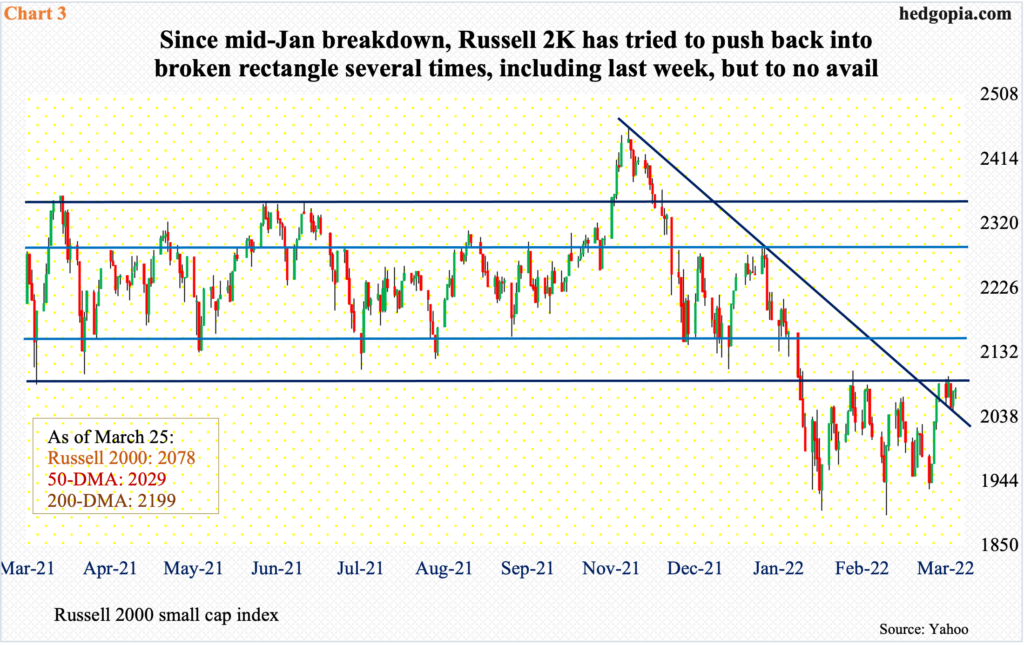
Small-caps are not experiencing the same level of oomph their large-cap cousins are showing. Mid-January, the Russell 2000 broke down from a months-long rectangle (Chart 3).
From last March through January, the small cap index played ping pong between 2350s and 2080s, and between 2280s and 2150s within this box. Early November last year, it broke out but was quickly followed by a failed retest on the 19th (November). Selling stopped near 1900, with a possible double bottom in late January and late February.
There is even a W look to it. But small-cap bulls first need to be able to push back into the broken box. They are getting rejected. This took place all of last week, ending the week down 0.4 percent to 2078.
Because these companies have a large exposure to the domestic economy, their weak price action at a crucial level is a matter of concern. The collective message coming out of the sector right now is not very encouraging.
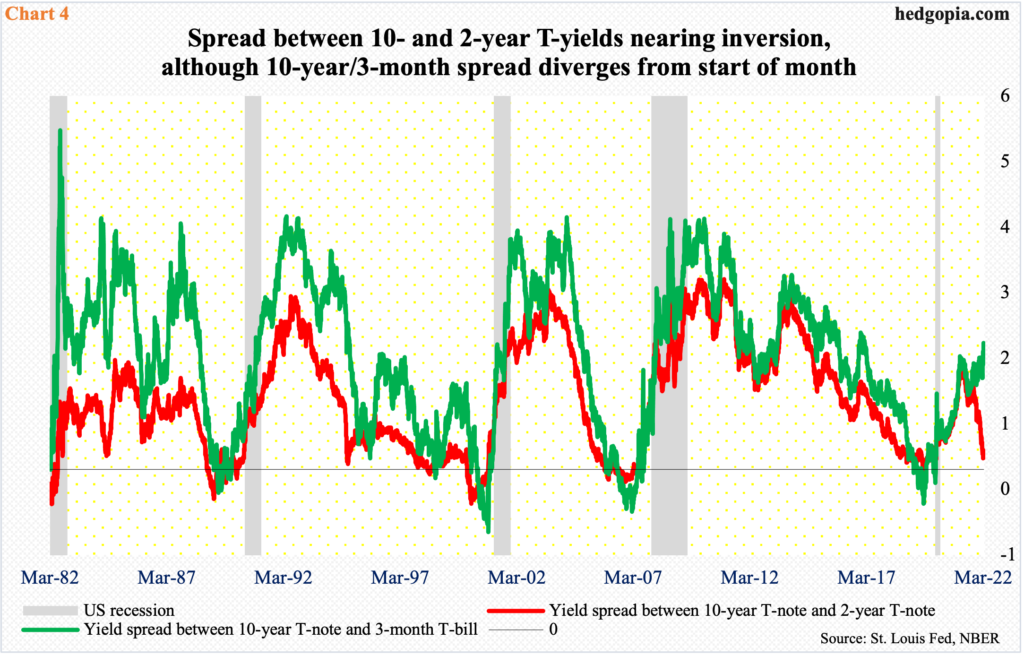
This is taking place at a time when rates have jumped big. The signal being telegraphed by the Eccles Building has gotten decidedly hawkish. The two-year treasury yield, which tends to closely track the Federal Reserve’s monetary policy, has gone up 100 basis points just this month alone – from 1.31 percent on the 1st to last Friday’s 2.30 percent. The 10-year yield went from 1.72 percent to 2.48 percent between the periods. As a result, the spread between the two shrunk from 41 basis points to 18 basis points. The red line in Chart 4 is nearing inversion. Historically, this has tended to precede contraction in the economy.
However, the 10-year’s spread with three-month bills has gone the other way from the start of the month – from 140 basis points to 193 basis points. The bond market is not completely sold to the idea of an imminent recession – not yet anyway.
The Fed is front and center. The hawkish meter has shot up since this month’s FOMC meeting (15-16) and particularly since last Monday when Jerome Powell, Fed chair, declared “inflation is much too high.”
At this month’s meeting, the fed funds rate was raised by 25 basis points; the Fed also said it would announce a plan to shrink its $9-trillion balance sheet in the next meeting, which falls on May 3-4; the dot plot signaled six more hikes this year – essentially one each in the remaining six scheduled meetings – but no 50-basis-point hike was signaled. This changed last Monday when Powell said that the central bank, if necessary, would be open to raising rates by a half-point at multiple FOMC meetings.
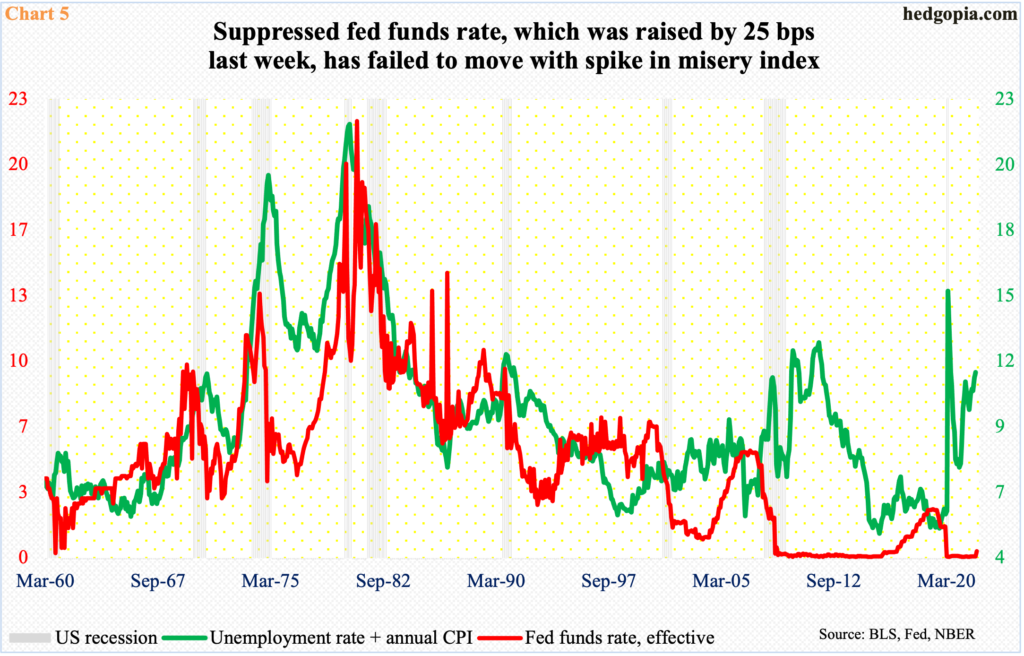
They are trying to catch up. Inflation is running rampant, with both the consumer price index and the personal consumption expenditures at four-decade highs. Chart 4 plots the fed funds rate with the misery index and it is evident the Fed left rates suppressed for far too long.
The misery index adds the unemployment to the inflation rate. The former in February was 3.8 percent – a two-year low – and the latter 7.9 percent, which was the highest since January 1982.
Given the shift in Powell’s tone, he may very well tighten until the economy contracts. Said it the other way, inflation may force his hand to do so. Equities, on the other hand, are beginning to bet on a soft-landing.
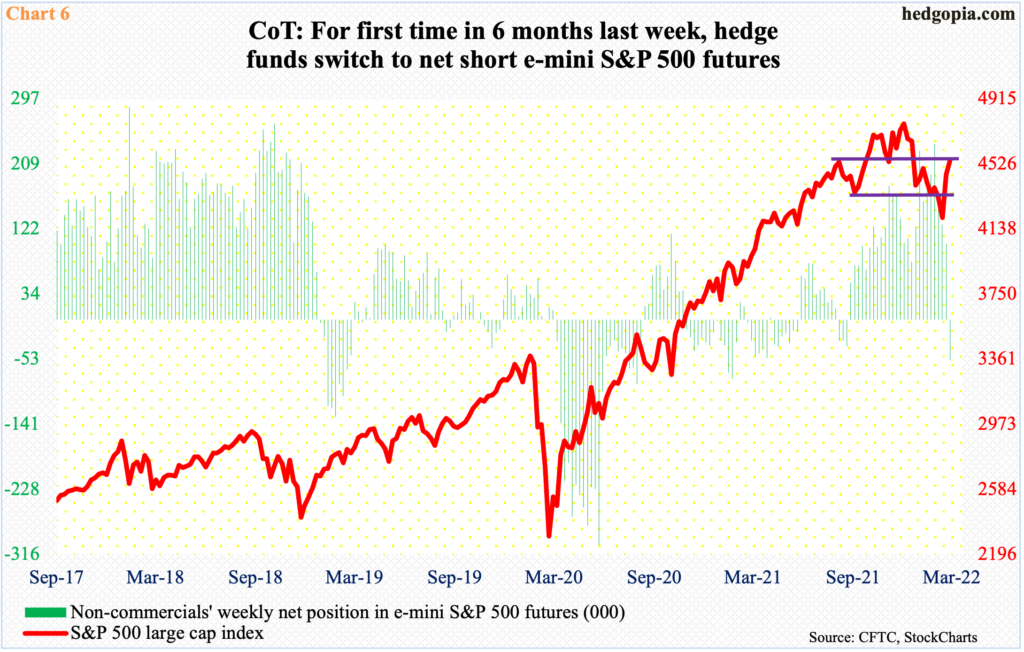
Amidst these dynamics, non-commercials last week went net short S&P 500 futures. In the week to March 15, they were net long 102,201 contracts. This flipped to 54,168 net shorts as of last Tuesday. This was the first time in six months that these traders had switched to net short (Chart 6).
As things stand, momentum is strong in the cash. At the same time, the S&P 500 is right at crucial resistance. Traders tend to pay close attention to the golden ratio (Chart 1). Probably betting this ceiling holds – at least for now—non-commercials aggressively leaned bearish last week.
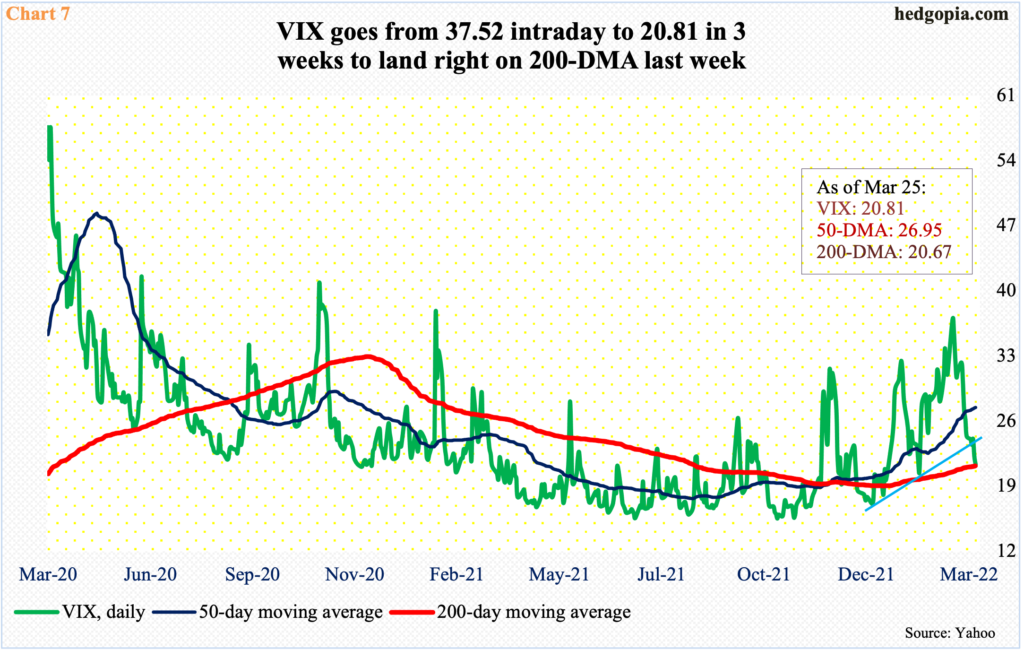
Concurrently, VIX (20.81) essentially closed at its 200-day (20.67) last week. It has been above the average, which is rising, for two and a half months now.
From a high of 37.52 on the 8th (this month), the volatility index got here rather quickly – in a matter of 14 sessions intraday.
Last week’s drop cost the index a rising trend line from early January (Chart 7). Hence the significance of the 200-day, which also approximates horizontal support at low-20s. The daily is oversold, so it is hard to imagine this support give way right away.
Thanks for reading!
