
Post-FOMC statement last Wednesday, equities sold off, but only to recover quickly. Investors have been preconditioned to buy the dips, with repeated success. The difference this time is that prospects for higher rates are real.
Federal Reserve Chairman Kevin Warsh made it official – just about – that short rates are headed higher; rates on the long end of the yield curve have been higher than the lows of March. Warsh’s hawkish self was very much evident last Wednesday as the FOMC meeting he maidenly chaired concluded.
Going into the meeting, markets were already baking in a 25-basis-point hike by December, sharply reversing from expectations early this year of at least two cuts this year; but they weren’t sure which way Warsh would lean. In his role as one of the governors back in 2006-2011, he was decidedly a hawk. But, given President Donald Trump’s persistent criticism of Warsh’s predecessor, Jerome Powell, for not lowering rates fast enough, it was assumed that Warsh would probably look for ways to argue for easing.
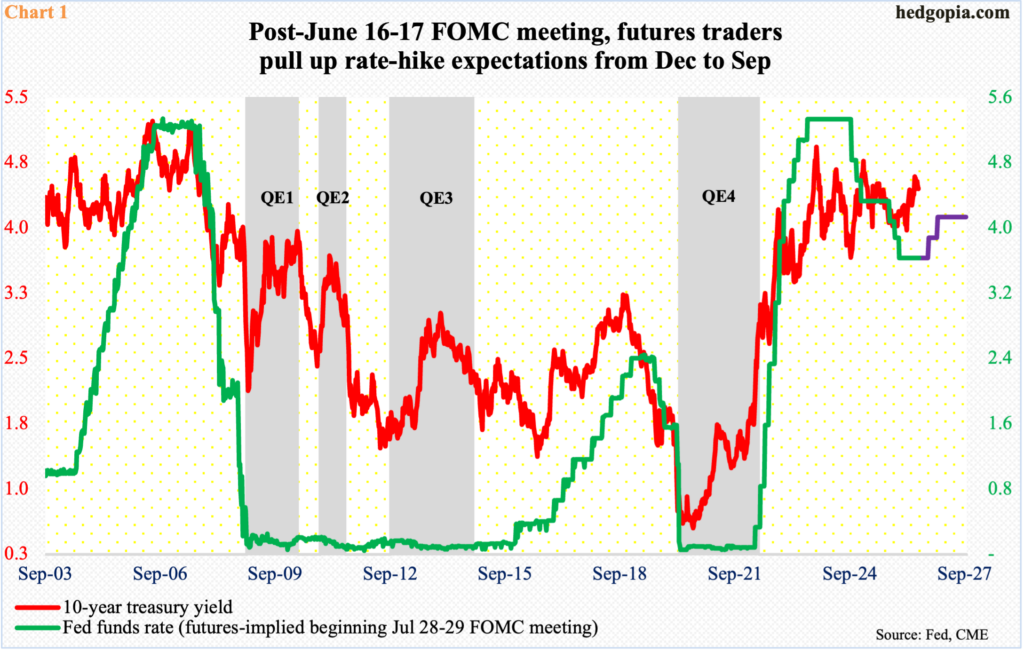
Last week, the fed funds rate was unanimously left unchanged at a range of 350 basis points to 375 basis points. After Warsh’s post-meeting comments “this committee will deliver price stability,” traders are now betting with conviction that a 25-basis-point rise would come as early as September, with a second hike in December (Chart 1). This is more than the June dot plot’s projection of one hike this year; policymakers’ March projections expected one cut this year. The bias has shifted hawkish.
The latest stream of macro data is making it easier for Warsh to sound tough on inflation, which is trending up.
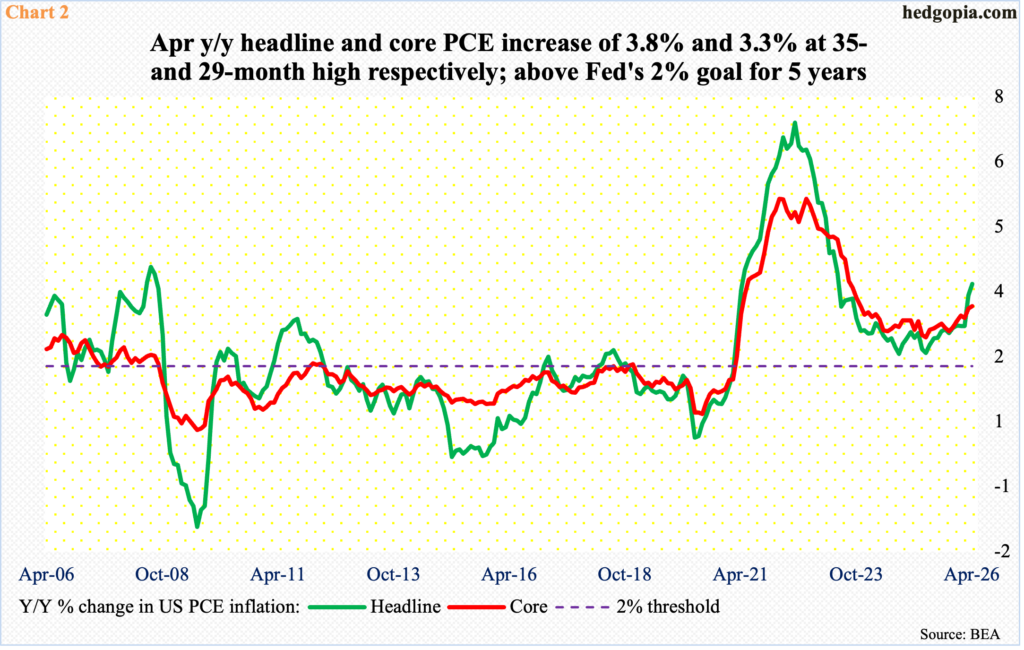
From a year ago, headline and core consumer price index for May came in at 4.3 percent and 2.9 percent respectively, representing a 37- and seven-month high, in that order. The trend is similar in PCE (personal consumption expenditures), which is the Fed’s favorite. In the 12 months to April, headline and core PCE registered growth of 3.8 percent and 3.3 percent respectively; this was the fastest pace in 35 and 29 months respectively. For five years, PCE inflation has remained north of two percent, which the central bank targets (Chart 2).
The Statement of Economic Projections (SEP) for June is forecasting headline and core PCE to reach 3.6 percent and 3.3 percent respectively by the end of 2026, up meaningfully from the March projection of 2.7 percent each. May’s report will be published Thursday and can be market moving.
For now, equities have not been bothered by elevated inflation readings. From the March 30 low through the latest intraday high of 7621 tagged on the 2nd this month, the S&P 500, in fact, gained 20.6 percent.
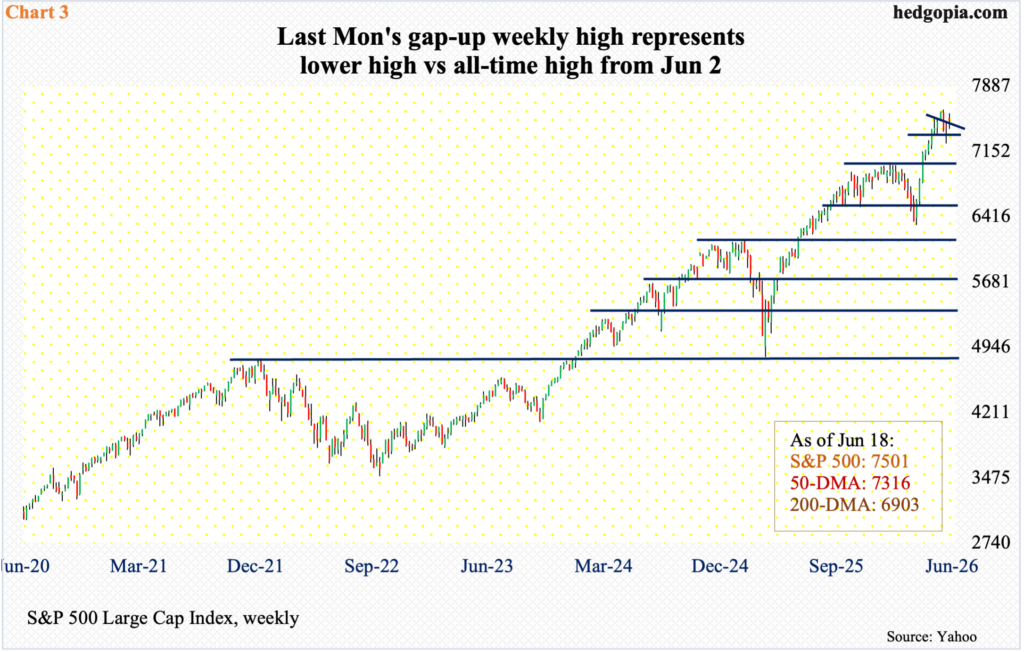
Last Wednesday, reacting to Warsh’s hawkish language and the resultant rise in long rates, the large cap index gave back 1.2 percent, but only to then rally 1.1 percent come Thursday. When it was all said and done, the index was up 0.9 percent for the week to 7501, forming a weekly spinning top, which shows up after the prior week’s potentially bullish dragonfly doji (Chart 3).
The S&P 500 remains way overbought particularly on the weekly. In the event it comes under pressure in the sessions ahead, the intraday low on the 9th this month of 7238 is worth watching. When that low was made, the 50-day was under it; now the average at 7315 would have been broken.
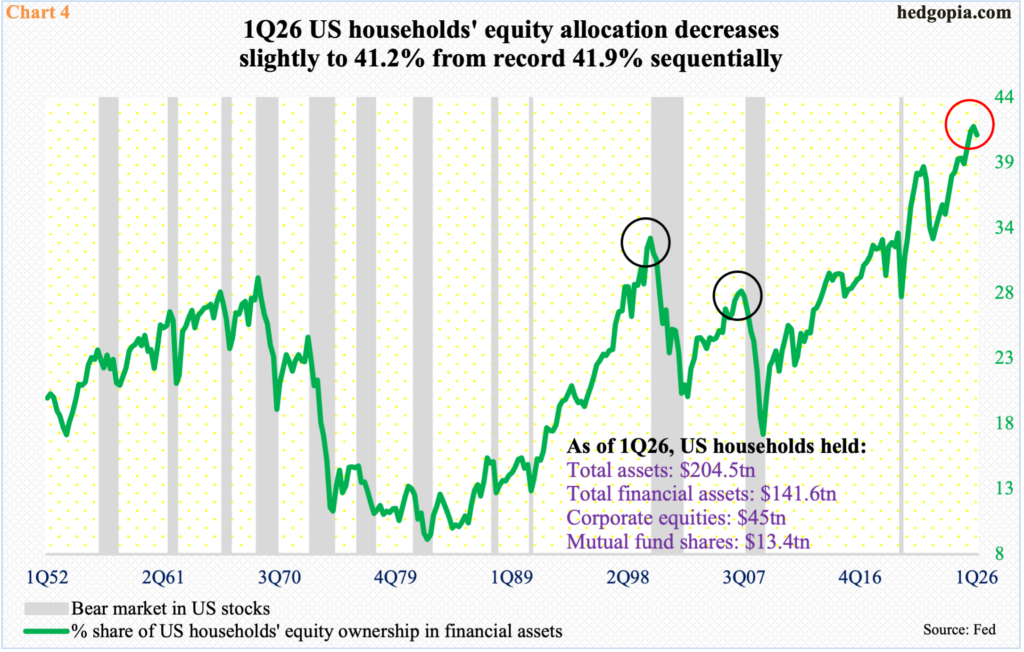
Equity bulls have had a phenomenal time since the lows of April last year. This is also evident in households’ equity allocation, which stood at 38.9 percent in 1Q25; historically, this was already too high. For reference, the bear-market highs of 32.9 percent in 1Q00 (dotcom) and 28.7 percent in 2Q07 (great financial crisis) look puny relative to where the allocation is currently (Chart 4).
As a matter of fact, except twice – 29.9 percent in 4Q18 and 28.2 percent in 1Q20 – the allocation has remained north of 30 percent since 1Q17, with the last four quarters through 1Q26 in the 40s. In the March quarter, the allocation was 41.2 percent, which was a little lower than the record 41.9 percent in the December quarter. The sequential drop reflects the two-month downward pressure equity indices were under through the late-March low.
It should not come as surprise if the allocation hits a new high in the June quarter. The S&P 500 has added nearly 15 percent in the current quarter, which has seven days of trading left.
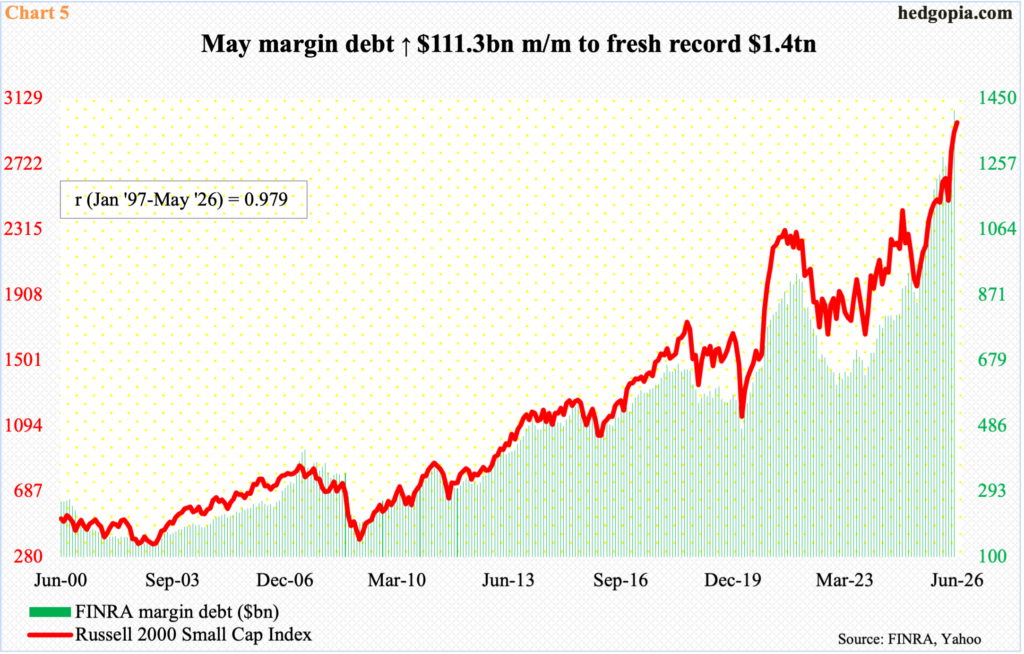
Concurrently, margin debt just hit a new high in May. At $1.4 trillion, it was up a massive $111.3 billion month over month, coming on the heels of gains of $83.4 billion in April from the preceding month (Chart 5). Again, equities bottomed in late March, and the gains in the major indices since have come on the back of a massive rise in leverage, which incidentally cuts both ways.
Right now, leverage is on the side of the bulls, that is for sure. It has been the right trade to bet on the long side and do so levering up, but things will not remain this way forever. There will come a time when this trade reverses and the bears will take over, as margin debt contracts.
When that happens, small-caps likely will suffer more – relatively, that is, versus large- and mid-caps – as they have a tighter correlation with margin debt. Using data going back to January 1997 through May, the Russell 2000 has a coefficient correlation of 0.979 (Chart 5).
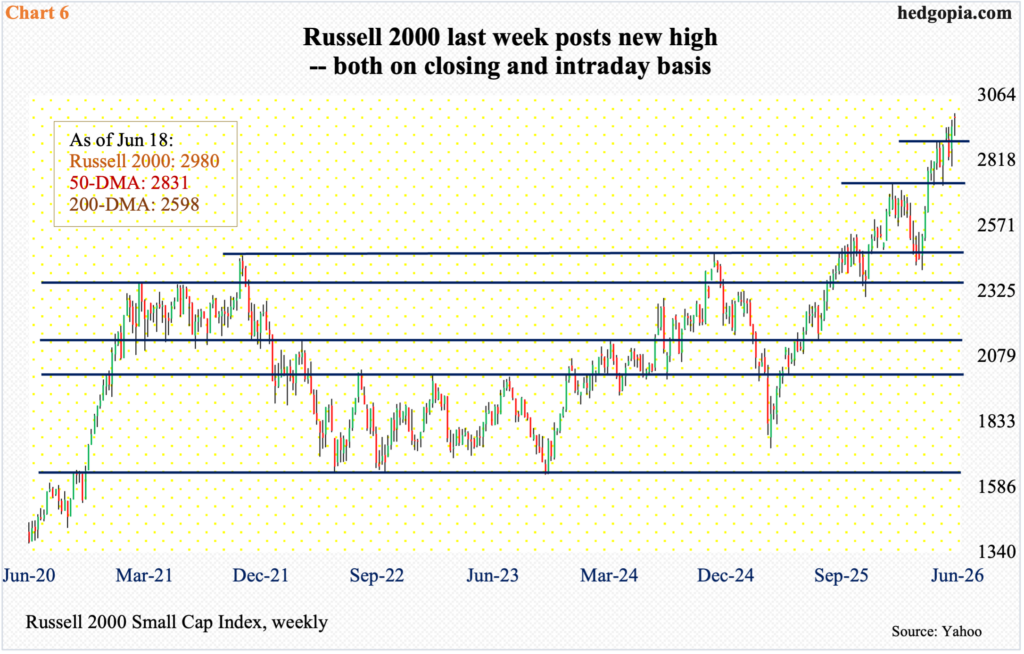
Right here and now, the Russell 2000 is sitting pretty. As is the case with margin debt, the small cap index, too, is a go-to area when investors are in a mood to take on risk. Last Monday, it ticked a fresh intraday all-time high of 2996, before closing the holiday-shortened week at 2980, up 1.2 percent for the week.
In the very near term, the Russell 2000 has carved out lateral support at 2940s, followed by 2880s (Chart 6).
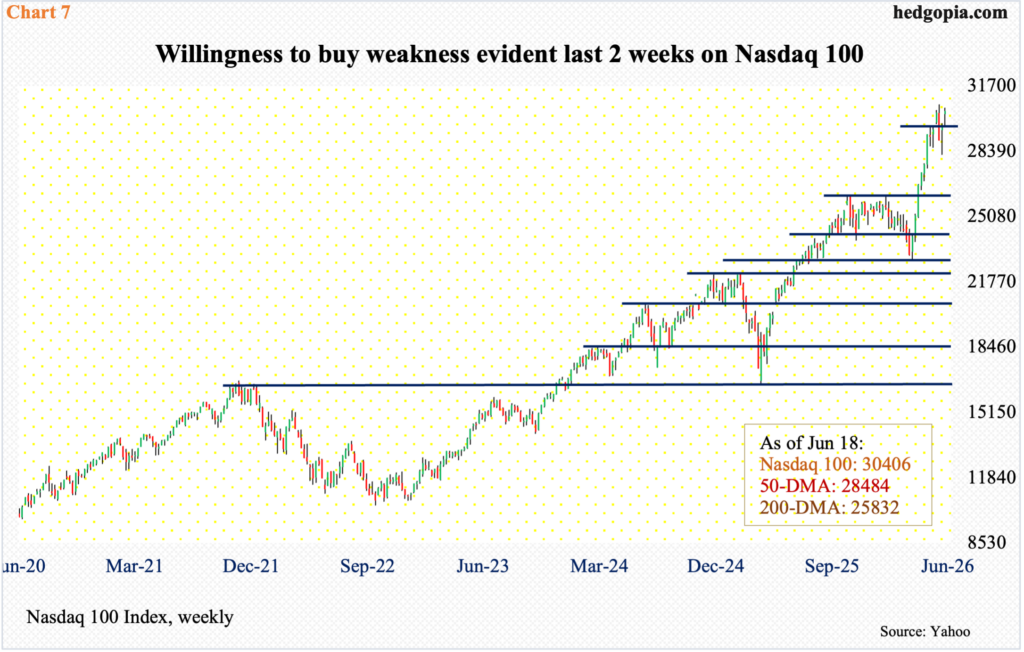
A similar short-term support level on the Nasdaq 100 rests at 29600s, which incidentally drew bids in Wednesday selloff. This was indicative of willingness to buy on weakness, as was the case in the preceding week, as a drop to just north of 28000 was embraced; both these weeks produced candles resembling a dragonfly doji (Chart 7). A breakout can happen at 30500s.
With that said, the Nasdaq 100 is overstretched particularly on the weekly. From the March 30 low to a fresh intraday all-time high of 30762 on the 3rd this month, it shot up just under 35 percent in just about two months. That is a lot of profit on paper, and the incentive to lock in the gains rises with signs of waning momentum, even sideways move. Thus far, last week’s trading has left the tech-heavy index with a lower high.
Thanks for reading!
