
Later this morning, August’s NFIB (National Federation of Independent Business) optimism index is published. July was 95.4, up 1.3 points month-over-month. The index has been under pressure since the recovery high of 100.4 reached last December. The last time it was north of 100 was in October 2006 (Chart 1). Hindsight is 20/20, but that peak turned out to be an important one.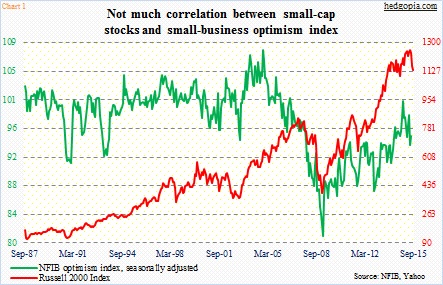
Looking at the chart above, there have been times small-cap stocks have moved in tandem with the optimism index, but over a long period of time the two have gone their own separate ways. As a matter of fact, between September 1987 and July this year, the R between the two was a minus 0.36. Hence, regardless how the August reading comes out, the NFIB index likely would not impact the Russell 2000 one way or the other. The latter marches to the beat of its own drum, and likely continues to do so.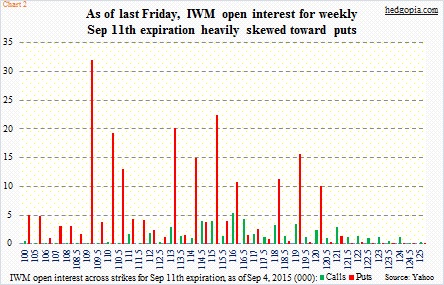
Of late, the story with small-cap stocks has been that of weakness. If we were to trust how market participants are positioned in options, the trend continues – at least this week. There is massive concentration of puts on IWM, the iShares Russell 2000 ETF, in the September 11th expiration, with the highest open interest of 32,000 in the 109 strike (Chart 2). The ETF has to drop 3.4 percent for this strike to be in the money!
Also in the futures market, non-commercials are sticking with their bearish bias on the Russell 2000. Last week, they were net short 41,801 contracts – lower from 46,064 two weeks ago but a total U-turn from net longs of 10,175 10 weeks ago (Chart 3). Kudos to them, having timed the peak in the index in near perfection! They are obviously betting that the index continues to come under pressure at best and goes sideways at worst, and have a reason to do so.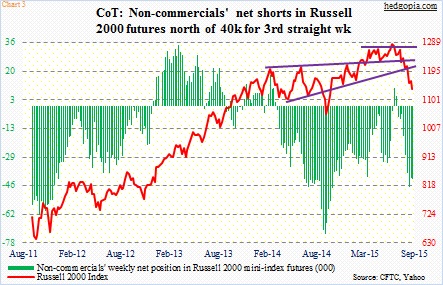
There has been technical damage wrought on the Russell 2000/IWM. The ETF has obviously lost major support at 118, which also approximates the neckline of a head-&-shoulders pattern. If there is any good in all this, it is that the August 24th intra-day low of $108.26 has met the post-break measured move target (Chart 4). So in an ideal scenario, that low should hold – at least near-term. In this scenario, the massive concentration of puts in the 109 strike may not all be long (Chart 2). Short puts could be in play as well. If so, this is bullish.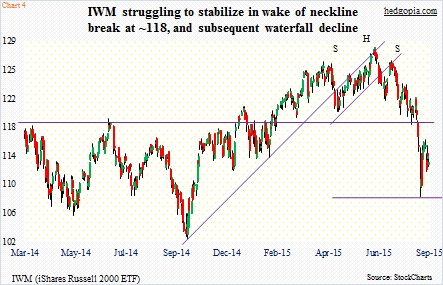
In fact, the Russell 2000 Index did outperform other major U.S. indices last week – down 2.3 percent, versus the S&P 500 Index, the Dow Industrials and the Nasdaq Composite, which were down 3.4 percent, 3.3 percent and three percent, respectively.
With that said, the ETF just suffered a death cross. Shorter-term moving averages are yet to stabilize. When it is all said and done, this could prove to be yet another good opportunity for covered calls – if nothing else just to reduce the cost.
To recall, back on August 14 August 21st weekly 119 puts were hypothetically sold for $0.92 – ended up going long the ETF at $108.08. Subsequently, two weekly covered calls were sold for a cumulative $3.15 that reduced the effective cost to $114.93.
Weekly September 11th 114 calls bring $1.04. If IWM ($112.87) ends up rallying this week at least one percent, it will be called away for a tiny profit of $0.11 – which is fine given this was a trade gone wrong right from the beginning. Else, the cost drops further to $113.89.
Thanks for reading!
