
The recovery in the economy from recent lows has been uneven. In equities, the S&P 500 (large cap) rallied to a new high last Friday, while the Russell 2000 (small cap) was rejected at a crucial resistance. Amidst this, several options-related metrics are out-and-out frothy.
The Covid-19 pandemic dealt quite a blow to the US economy. Real GDP contracted at a seasonally adjusted annual rate of 32.9 percent in 2Q20, preceded by a drop of five percent in 1Q. This was a first back-to-back contraction since 2Q09.
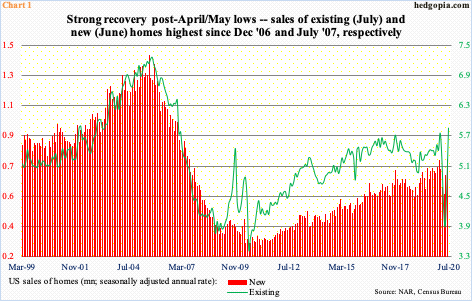
Several other data points have recovered, some quite strongly. Housing, for instance.
Sales of both new and existing homes experienced quite an upward push. Sales of existing homes bottomed at 3.91 million units (SAAR) in May, with June and July up 20.2 percent and 24.7 percent month-over-month to 5.86 million, which was the highest since December 2006. New homes, similarly, bottomed in April at 571,000 units (SAAR), before rising 19.4 percent m/m in May and 13.8 percent in June to a 13-year high 776,000 units (Chart 1). (July’s numbers will be reported tomorrow.)
Builder optimism accordingly is very high. The NAHB Housing Market Index in August surged 48 points from April to match the December 1998 record high of 78 (chart here).
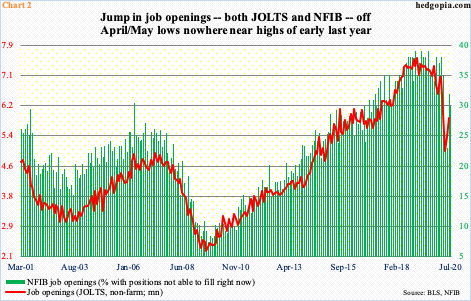
That said, the recovery off the lows has been uneven. Job openings, for instance.
Non-farm job openings (JOLTS) dropped to five million in April, before rising to 5.4 million in May and 5.9 million in June. They are still down big from seven million in both January and February, not to mention the record high 7.5 million in January last year.
Along the same lines, the NFIB job openings sub-index stood at 30 in July, up from 23 in April, but this was much lower than 39 which was hit three times between December 2018 and July 2019 (Chart 2).
In other words, depending on one’s bias, an optimistic case can be made as easily as a pessimistic one.
Arguably, this divide is also reflected in how large-caps and small-caps are trading.
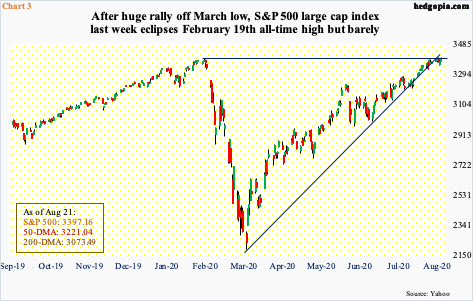
Large-caps are leading. On February 19, the S&P 500 peaked at 3393.52. Soon, the rug was pulled out from underneath the large cap index. By March 23, it bottom-ticked 2191.86. The rally off of that low culminated in last week’s takeout of the February high; Friday, it closed at 3397.16, with the intraday high of 3399.96.
Thus far, an all-encompassing V-shaped recovery has eluded the US economy, but not the S&P 500, which just completed a round trip over six months (Chart 3).
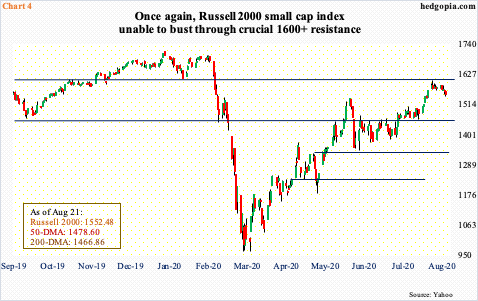
The Russell 2000 small cap index, on the other hand, just got repelled at a crucial level.
First of all, unlike the S&P 500 which just posted a new high, the Russell 2000 peaked as far back as August 2018 at 1742.09. Just before the February-March collapse this year, it tagged 1698.91 on February 20. Four trading weeks later, on March 18, it made a low of 966.22. The rally off of that trough took care of many roadblocks, including 1450s-60s, which gave way mid-July. But a bigger one lied just north of 1600, which goes back to January 2018, and that proved tough.
Last Tuesday, the Russell 2000 tagged 1603.60 intraday; plus, in three of the remaining four sessions, it rallied to 1590s (Chart 4). Offers were much stronger than bids in that region. It closed out the week at 1552.48. In due course, 1450s-60s may now act like a magnet.
The bigger question is if this would accompany weakness in the S&P 500 as well. The index may have posted a new high last week but it increasingly feels like it has been begrudgingly pushing higher without much participation from volume.
Importantly, both the S&P 500 and VIX rose last week, up 0.7 percent and 2.2 percent respectively. This is a rare occurrence. More often than not, they tend to go in the opposite direction.
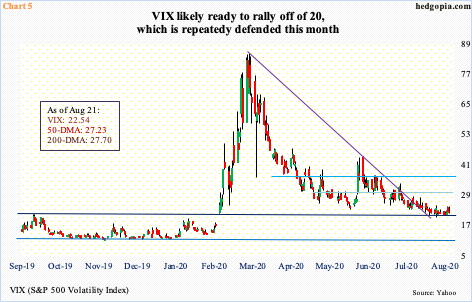
As the S&P 500 was bottoming in March, VIX peaked at 85.47 on the 18th that month. One after another support fell on the way down. Then, several times this month, the volatility index kissed the 20 handle and rallied (Chart 5).
Last Wednesday’s intraday drop to 20.99 found support at the daily lower Bollinger band (20.79). The upper band, at 25.48, means the spread is quite narrow. Concurrently, the 50- and 200-day moving averages have converged – respectively at 27.23 and 27.70. At the same time, only 0.80 separate the 10- and 20-day, with both beginning to wear a flattish look. On the weekly, last week formed a long-legged doji and a spinning top before that. These candles have appeared after the massive volatility compression since the March high, even as several weekly indicators have been pushed into oversold territory.
Odds favor volatility begins to perk up.
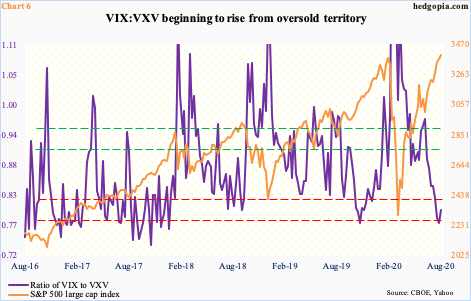
In this scenario, the ratio of VIX to VXV can rise. VIX measures market’s expectation of 30-day volatility on the S&P 500; VXV does the same, except it goes out to three months. When investors are in a risk-off mode, demand for nearer-term protection goes up, meaning VIX rises more than VXV. The opposite occurs when sentiment shifts to risk-on.
Most recently, the ratio entered overbought territory in June. VIX:VXV began to retreat after it hit 0.97 in the week of June 22. After a brief selloff, the S&P 500 was in the process of bottoming back then, which it did on the 29th that month by tagging 2999.74 – between the 200- and 50-day.
Fast forward, the S&P 500 is 400 points higher, and the ratio closed last week at 0.80, which was preceded by 0.78 in the prior week and 0.79 in the week before that (Chart 6). This is oversold territory. The ratio hooked up last week and has tons of room to continue higher before the oversold condition it is in gets unwound.
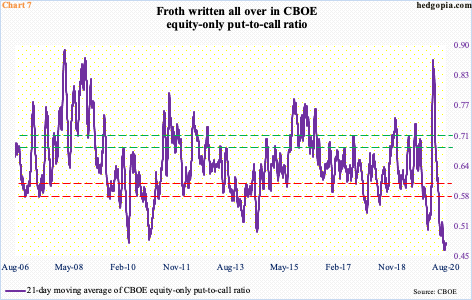
Speaking of unwinding, Chart 7 plots the 21-day moving average of the CBOE equity-only put-to-call ratio. It ended last Friday at 0.473. On the 5th this month, the ratio registered 0.463. This is froth territory.
Historically, the 21-day average tends to begin a process of unwinding once it drops to mid- to high-0.50s. This time around, it has remained sub-0.50 since July 14. During the February-March selloff, the pendulum heavily swung to the other side by spiking to 0.867, which laid the foundation for the subsequent rally in equities. Five months later, fear has given way to greed. This will get unwound – it is a matter of when not if.
As things stand, except for the Russell 2000 failing to clear 1600+, other major indices such as the S&P 500 remain near their fresh highs. The trend remains up, with indices comfortably above shorter-term averages. Amidst this, how VIX is behaving should give bears some hope. Once the trend reverses, a lot, such as Charts 6 an 7, remains to be unwound, and that should help the trend persist.
Thanks for reading!
