
US Manufacturing has contracted for three months now. Markets are not a least bit bothered. They are hoping the Fed’s three rate cuts this year would boost a decelerating economy. In the futures market, non-commercials are betting with record net shorts in VIX futures that volatility would drop further. Medium- to long-term, VIX peaks once these traders go net long; a rise in volatility will coincide with a decline in stocks. That said, near term, momentum lies with equity bulls.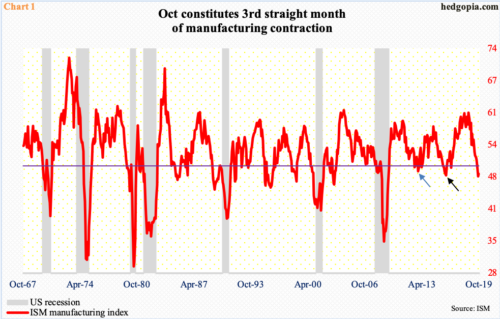
US manufacturing is in contraction. The ISM manufacturing index came in at 48.3 in October, up 0.5 points month-over-month. This can be spun by both bulls and bears to suit their own biases. The positive aspect is that although in contraction the index edged up from September’s 123-month low. On the negative side, this was the third straight monthly contraction.
Post-Great Recession, the manufacturing index fell below 50 14 different times, including the last three months. In late 2012, there were two consecutive months of contraction (blue arrow in Chart 1). In 2015-2016, there were five successive sub-50 readings (black arrow), before activity recovered to eventually peak at the cycle high 60.8 in August last year.
Equity markets – mostly large-caps – are currently betting things do not deteriorate much from here.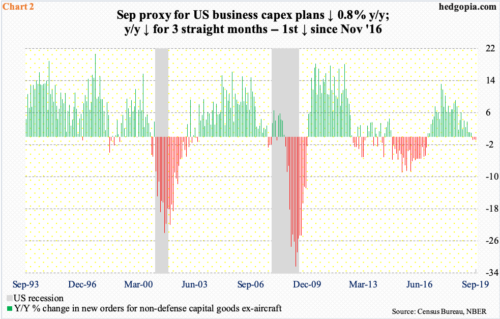
Optimists’ best hope is that the Fed’s easing in its policy rate this year will reverberate through the economy in a favorable manner. Last week, it delivered a third straight quarter-point reduction in the fed funds rate, to a range of 150 to 175 basis points.
It is too soon to say if things will indeed evolve this way. The economy is in its 11th year of recovery/expansion after Great Recession. It has been the longest expansion to date. Nothing says it cannot continue. Nonetheless, signs of wear and tear are showing up. Corporate capex in particular has disappointed.
Preliminarily in September, orders for non-defense capital goods ex-aircraft – proxy for business capex plans – dropped 0.8 percent year-over-year to a seasonally adjusted annual rate of $68.6 billion. The metric peaked in July last year at $70 billion. September’s was a third consecutive y/y decline, which was the first such occurrence since a two-year contraction ended in November 2016 (Chart 2).
Once again, going by how equities are behaving, bulls to not expect this deceleration to continue, or, for that matter, consumers to take a break.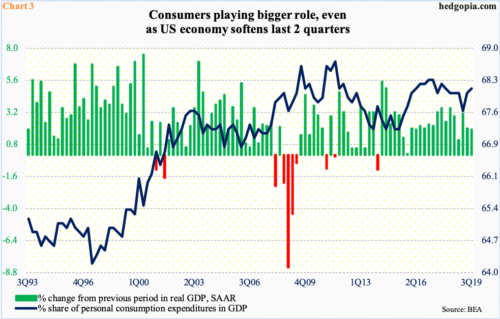
In recent quarters in particular, consumers have essentially carried the economy on their shoulders.
In 3Q19, real GDP grew 1.9 percent, which precisely matched the contribution from personal consumption expenditures (PCE). Contribution from private investment, inventories and net exports was negative, with only government contributing positively. In 2Q19, the mix was the same, with real GDP growing two percent and PCE contributing three percent.
Consequently, PCE’s share in GDP rose from 67.6 percent in 1Q19 to 68.1 percent in 3Q (Chart 3). Markets are currently priced in for continuation of this, and for volatility to remain subdued.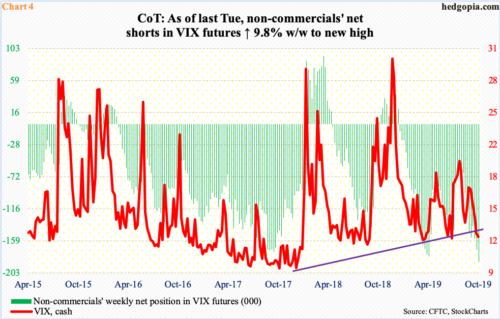
Non-commercials are sitting on record net shorts in VIX futures – 187,948 contracts as of last Tuesday – eclipsing the prior high of 180,359 from April this year (Chart 4). The cash (12.30) has persistently made lower highs since tagging 24.81 intraday on August 5. On Monday last week, it broke support at 13.50s, facing resistance at the 10-day moving average. These traders are positioned as if volatility is still headed lower. Since April last year, VIX has not broken 10-11. Its all-time low of 8.56 was recorded in November 2017.
No matter what transpires near term, if past is prologue, the prevailing trend will in due course transition to a countertrend. The current bearish bias is too lop-sided. Once unwinding begins, non-commercials will be covering. As a matter of fact, historically VIX has shown a tendency to peak only after these traders either go net long or substantially cut their holdings.
Unwinding can begin because (1) the bullish scenario in equities does not pan out, and/or (2) it pans out, but since it is already in the price, the law of gravity holds.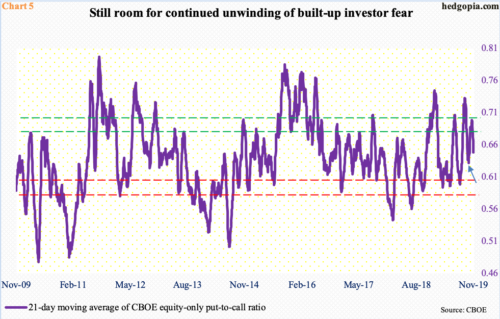
Immediately ahead, a battle likely gets fought between Charts 5 and 6, which will decide which way things are headed near term.
The CBOE equity-only put-to-call ratio printed 0.53 last Friday, which was a fourth 0.50s reading in the past six sessions. Investor optimism is on the rise. The 21-day moving average of the ratio ended last week at 0.649, down from 0.699 on October 18. If past is prologue, it can continue to unwind until it hits high 0.50s to low 0.60s, before it goes the other way. On September 24, it bottomed at 0.632 (arrow in Chart 5), which coincided with the S&P 500 coming under slight pressure into early October. Should the ratio continue to unwind, particularly into the red zone, stocks likely rally more.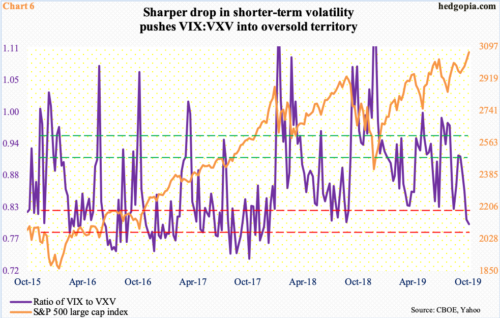
But then we have Chart 6, which pits the ratio of VIX to VXV with the S&P 500 large cap index. VIX uses S&P 500 options to measure market’s expectation of 30-day volatility. VXV does the same except it goes out to three months.
When stocks are rallying, volatility takes a back seat, with premium coming out of shorter maturity faster than long end of the curve. This is happening right now. On a closing basis, VIX:VXV read 0.798 last Friday, down from 0.805 a week ago. Six weeks ago, the ratio closed at 0.918 and at 0.971 late August; stocks rallied as the overbought ratio got unwound. Now, it is the other way around.
Last week’s was the first sub-0.8 reading since January last year. This will get unwound. When that happens, VIX will rally faster than VXV, and stocks come under pressure. The only question is if the ratio manages to go sideways before turning back up, which has happened in the past. In this scenario, Chart 5 and Chart 6 move together, giving more room for stocks to rally.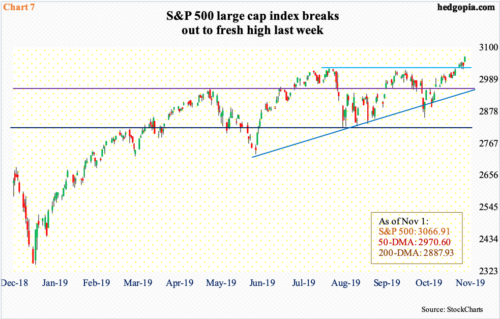
Bulls carry the momentum ball. In the past month, the S&P 500 (3066.91) jumped more than seven percent – in pretty much a straight line. In the process, it not only reclaimed the 50-day, which is now rising, and horizontal resistance at 2940s-50s but also broke out to a new high.
The daily is grossly overbought, but bulls at the same time have been defending shorter-term averages, particularly the 10-day. Encouragingly for them, they defended breakout retest at 3020s both Wednesday and Thursday last week. This is the level to watch for now. Nearest Support lies at 3050.
Thanks for reading!
