
With subtle signs of distribution hitting major equity indices in recent sessions, results from the top six US companies – all tech – could not have come at a more important juncture.
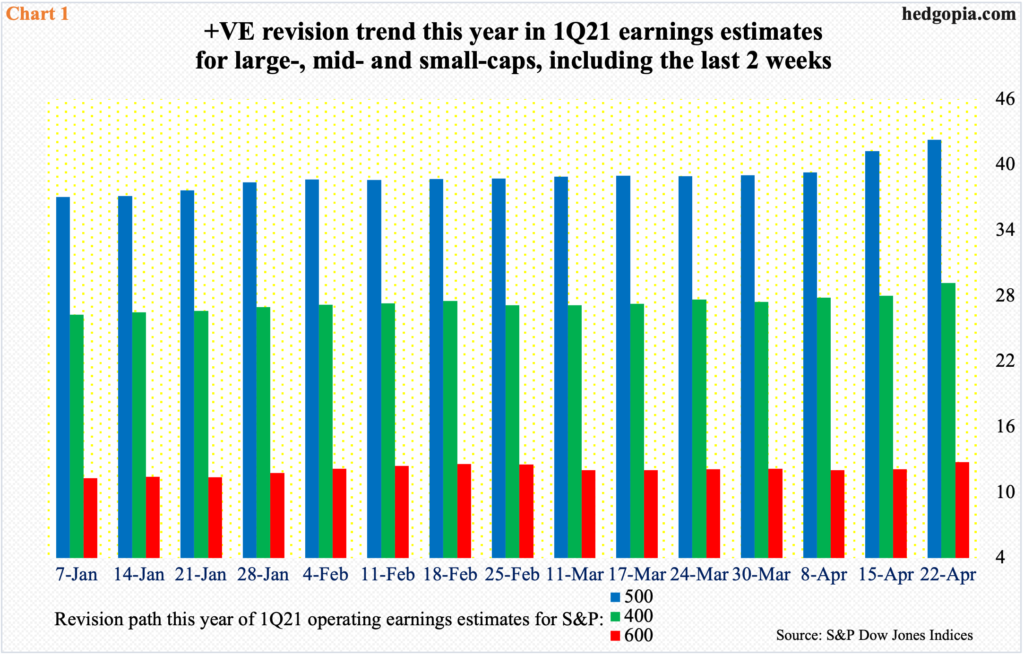
The 1Q21 earnings season is one fourth through. Profits have come in stronger than expected. Since companies began reporting in earnest two weeks ago, blended estimates have gone up in all three categories: small-, mid- and large-caps.
As of the 8th this month, S&P 500 companies were expected to earn $39.31 in operations, S&P 400 $27.85 and S&P 600 $12.05. As of last Thursday, estimates had risen to $42.28, $29.19 and $12.76, in that order (Chart 1).
In fact, the revision trend improved as 2021 began. At the end of 2020, these estimates were $37.04, $25.88 and $11.36.
Stocks rallied massively into earnings and are beginning to stall as the reporting season got underway. Just in the first quarter, the S&P 500 rallied 5.8 percent, the S&P 400 13.1 percent and the S&P 600 17.9 percent. With five sessions to go this month, the S&P 500 and 400 are up another 5.2 percent each and the S&P 600 2.3 percent.
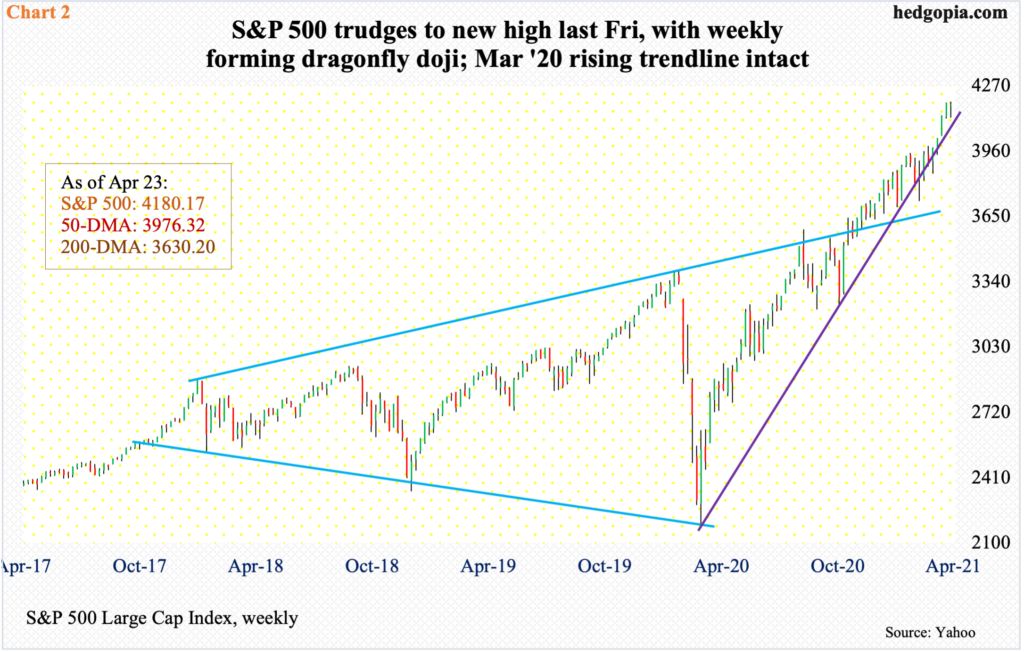
Sellers are beginning to show up. Through Tuesday’s low last week, the S&P 500 was down 1.6 percent, the S&P 400 2.6 percent and the S&P 600 4.1 percent; but by Friday, the S&P 500 rallied enough to end the week down only 0.1 percent, while the S&P 400 and 600 were up 0.9 percent 0.2 percent respectively. As a result, all these three indices produced weekly candles with long lower shadows.
The S&P 500’s dragonfly doji indicates that the bulls were able to soak up the early selling but at the same time suggests a potential reversal in the making. It can be a bearish candle but needs confirmation. The rising trend line from the low of last March is intact, but barely. Last Tuesday’s low just about kissed that support (Chart 2).
This week is key. Several tech bigwigs report their March quarter.
The rather lackluster action also comes even as the FOMC gets ready to meet this week. Not a whole lot is expected to come out of this meeting. In the March meeting, members updated their economic projections. Real GDP growth forecast for this year was raised to 6.5 percent, up from 4.2 percent last December; core PCE inflation forecast went from 1.8 percent to 2.2 percent.
Against this backdrop, several companies including Coca-Cola (KO), Procter & Gamble (PG), Kimberley Clark (KMB), Owens Corning (OC), Waste Management (WM), and DR Horton (DHI) have commented on rising cost pressures. In March, US existing home prices were up 17.2 percent year-over-year to $329,100 – a record.
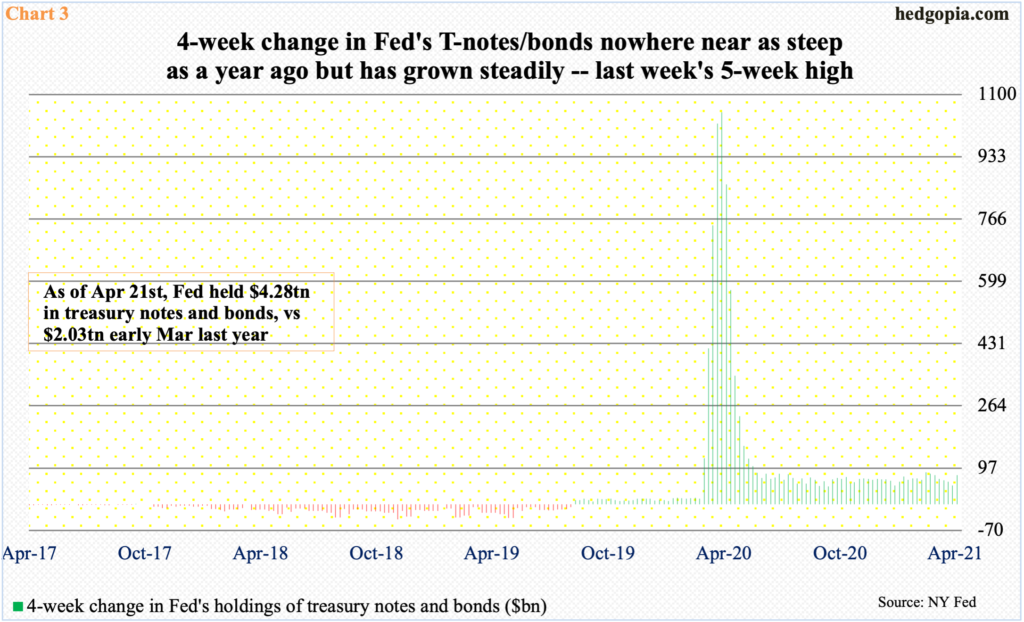
The Fed continues to believe that the pickup in inflation is transitory; inflation is expected to moderate next year. Money-printing continues. In early March last year, the central bank held $2 trillion in treasury notes and bonds. As of last Wednesday, this stood at $4.3 trillion.
The Fed massively expanded its balance sheet in response to Covid-19 – from $4.2 trillion in late February last year to last week’s $7.8 trillion. It is spending up to $120 billion/month in purchases of mortgage-backed securities and treasury notes and bonds, with the latter rising $78.7 billion in the last four weeks (Chart 3). The pace of accumulation of these securities has slowed down versus a year ago, but momentum is steady. This ensures a lot of liquidity in the markets, which stocks tend to cherish.
By accumulating all these securities, the Fed wants to ensure long rates remain low. The fed funds rate on the short end is already zero-bound between zero and 25 basis points. After ticking 1.77 percent on March 30, the 10-year treasury yield has come under pressure, tagging 1.53 percent intraday but closing at 1.57 percent last Friday; the 50-day moving average at 1.55 percent was defended. There is room for a test of 1.4 percent in the weeks ahead, but right here and now, rates can rally, as the daily is getting oversold. There is resistance at 1.63 percent.
Currently, it is popularly believed that tech stocks have gotten hurt as rates rallied, although it is hard to draw this correlation historically.
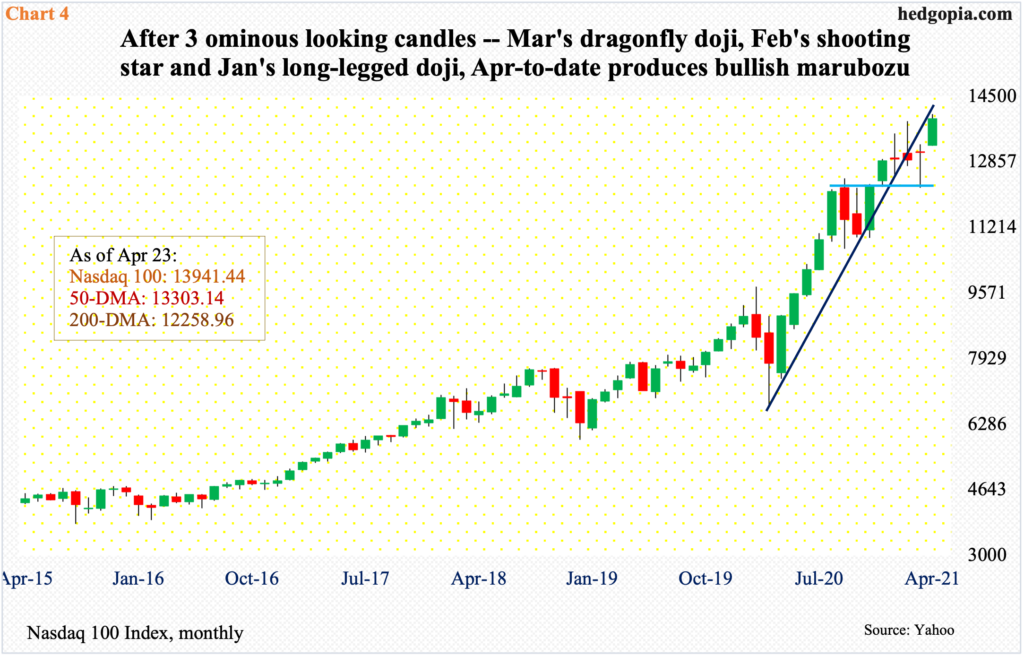
There are five sessions left this month, and the Nasdaq 100 is up 6.5 percent. The monthly has formed a bullish marubozu. If this candle sticks, this will help negate the prior three candles showing distribution – a dragonfly doji in March, a shooting star in February and a long-legged doji in January (Chart 4).
Last week, there was a lot of back-and-forth around the 10-day. In fact, through Wednesday’s low, the index was down 2.3 percent for the week; Friday’s rally helped it cut the loss to a decline of 0.7 percent.
All eyes are pinned on what the top six US companies – all tech – bring this week.
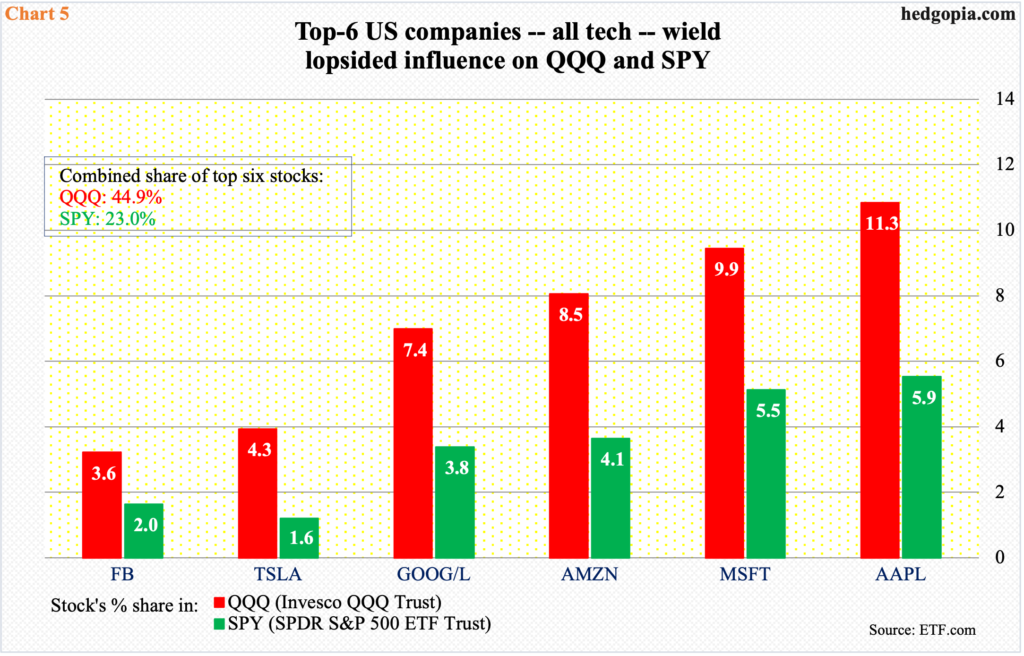
Tesla (TSLA) reports on Monday, Microsoft (MSFT) and Google owner Alphabet (GOOG) on Tuesday, Apple (AAPL) and Facebook (FB) on Wednesday and Amazon (AMZN) on Thursday.
Combined, they wield an outsize influence. In QQQ (Invesco QQQ Trust), their combined share is 44.9 percent and in SPY (SPDR S&P 500 ETF) 23 percent. The axiom ‘as they go, so go equity indices’ is not an exaggeration, particularly for the ones weighted by market cap.
Ahead of this week’s results, only GOOG and MSFT closed at new closing highs last Friday. AAPL and TSLA are 7.3 percent and 19 percent below their respective January 2021 highs, AMZN six percent below its September 2020 high and FB 4.7 percent from this month’s high.
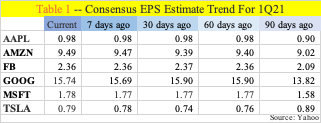
Going into this week’s reports, the revision trend is up for all six, except TSLA. Three months ago, it was expected to earn $0.89, which has now been revised downward to $0.79 (Table 1). This lowers the bar, but at the same time reflects sell-side caution ahead of results.
From this perspective, analyst’s conviction level remains high for the remaining five.
Bulls are hoping post-earnings reaction is favorable. Last week, he Nasdaq 100 was unable to build on the prior week’s momentum in which a new high was recorded. In fact, the tech-heavy index (13941.44) retreated right after the intraday high of 14050.38 on April 16.
Depending on how the week shakes out, April’s bullish marubozu can easily turn into a candle with a long upper shadow. This would further lend credence to the first three ominous looking monthly candles this year.
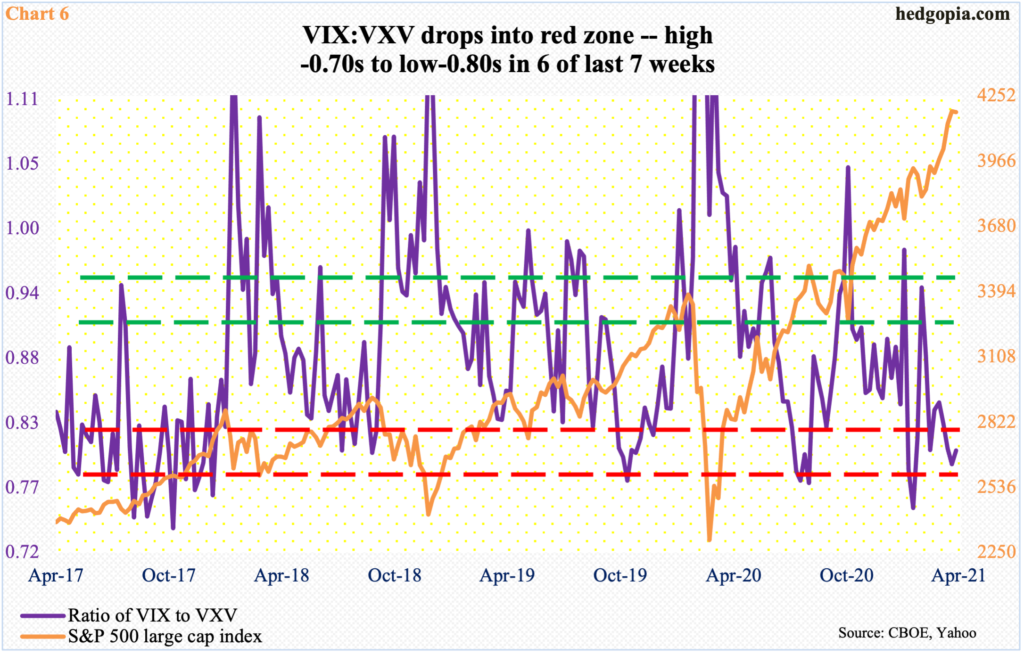
In this scenario, the ratio of VIX to VXV, which is in oversold territory, can begin a process of unwinding.
VIX measures expectations for 30-day volatility using S&P 500 options. VXV does the same except it goes out to 90 days. Last Friday, the ratio closed at 0.80 and at 0.79 in the week before that. In fact, in six out of the last seven weeks, the ratio closed at low-0.80s to high-0.70s (Chart 6).
With that said, several times in the past, VIX:VXV has dropped into oversold zone and gone sideways. Bulls are hoping for a repeat of that. If this were to happen, results from the top six need to cooperate. At 23 percent, their share of the S&P 500 market cap is just too big to ignore.
Thanks for reading!
