
- U.S. stocks shake off early weakness before carving out major reversal
- Bulls step up to plate, refuse to give away support zones on major indices
- VIX and ISEE index suggest stocks’ path of least resistance probably up N/T
If you are having difficulty making heads or tails of market action yesterday – or for a while, for that matter – you are not alone. Of late, this has been an awfully tough market to trade. There has not been much trend, just a lot of vacillation.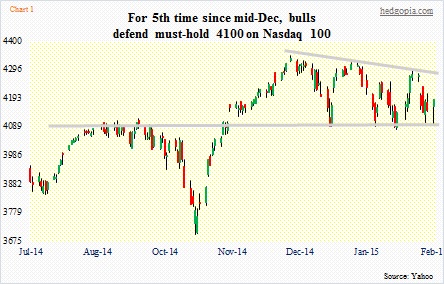
In four of the past five sessions the S&P 500 swung 1.3 percent – three down and one up; the fifth one was up one percent. In seven of the last eight sessions, the Dow Industrials ended with a triple-digit gain or loss – three up, four down.
Such volatility does not speak of a healthy market. This is a market caught in confusing crosscurrents of both bulls and bears trapped in indecision.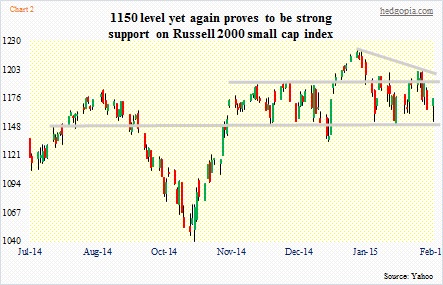
With that, the action yesterday was great, but does it change anything? It probably does, at least in the near-term.
To be fair, a trader could not have asked for more yesterday. Swings were extremely wild. On the S&P 500, there were two separate 30-point swings – one starting around 10AM and the other at 2PM.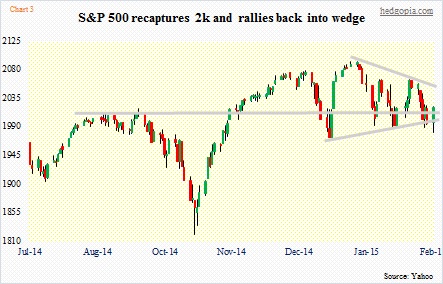
But what jolted the bulls into action? Was it the fact that oil was finally getting some bids? Or was it the proposal of Yanis Varoufakis, Greece’s finance minister, for a debt swap that would avoid the need to use a term such as a debt “haircut.” Or maybe stocks were simply rallying ahead of the jobs report this Friday.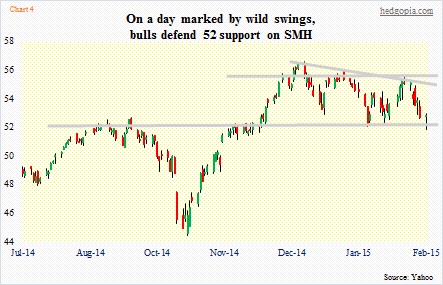
Whatever it was, buyers stepped in to defend the support zones they needed to save. So it was equally plausible that it were these levels that drew the buyers in. Look at Chart 1. Buyers swooped in to buy the Nasdaq 100 (4188.59) around 4100. That was the level, among others, that was identified in Monday’s blog. Or Chart 2, which saw the 1150 level on the Russell 2000 small cap index (1175.51) defended. Chart 3 has the S&P 500 (2020.85) not only retake 2000 but also the wedge it has found itself in for nearly two months now. The index traded down near its mid-December low but did not trade through; that low, however, was successfully tested in the futures market. The story is the same with the semi ETF, SMH (52.83), which rallies back to save the critical 52 support (Chart 4). The Dow Industrials (17361.04) bounced off of its 200-day moving average.
When it was all said and done, there were hammers all around. This is a bullish candlestick formation, and indicates the bulls are strengthening. It will be interesting to see if they are able to build on it. All these indices, and several more, still have to deal with the fact they have been persistently making lower highs in recent weeks. Plus, their respective 50-day moving averages are not that far away – SMH, 2.4 percent away; S&P 500, 1.2 percent; NDX, one percent; Russell 2000, 0.4 percent; and Dow Industrials, 1.8 percent.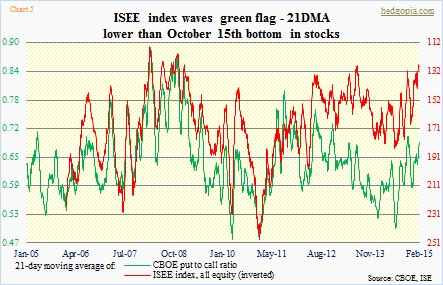
For now, the reversal should give the bulls enough ammo to try to at least go attack the 50DMA. They probably have one more thing going for them, which is Chart 5. As can be seen, the CBOE put-to-call ratio is not that oversold, but the ISEE index is lower than it was during the October 15th bottom. The VIX too probably wants to go lower from here. The past three sessions, it has consistently closed well off its daily highs.
The next couple of days should provide more clues. But the way it is looking now, dips will be lapped up.
One thing to keep in mind: all these indices yesterday refused to succumb to pressure that was thrown their way (positive) but continue to remain within either a range or a descending triangle or a wedge (neutral at best, negative at worst). They are yet to break out.
