
Equity bears attacked where they could potentially have last week. With technicals in their favor, they will try to make further gains this week. It is up to the tech bulls to stop that from happening. Major tech outfits are reporting this week.
Last week, large-cap bears stepped up to the plate where they had the highest odds of success, and they succeeded.
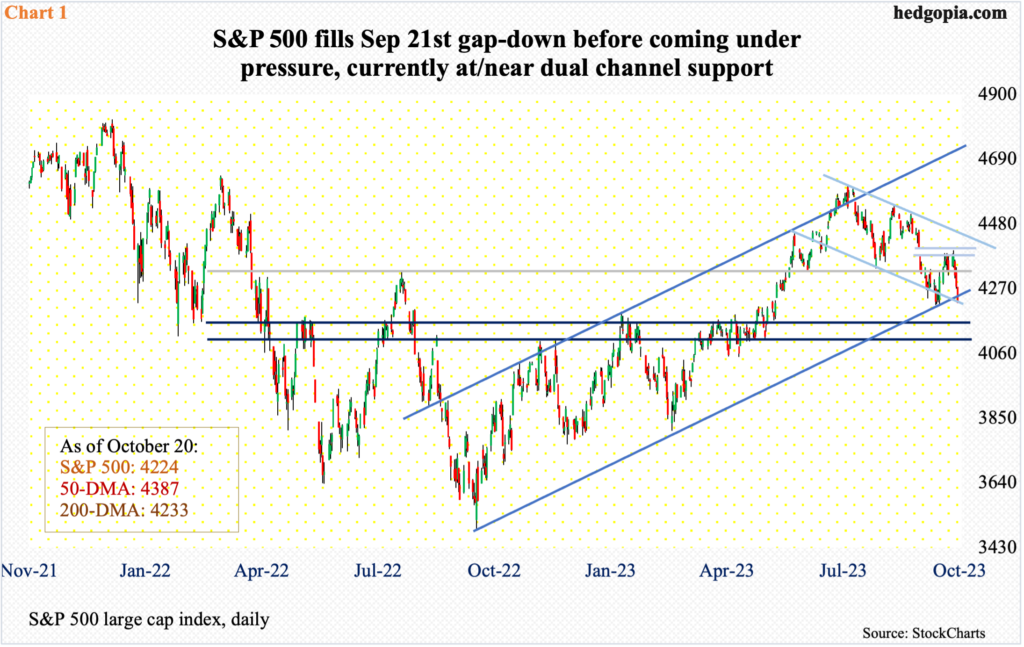
On September 21st, the S&P 500 gapped down to later bottom in the first week this month just above the 200-day moving average. The gap would have filled at 4401. Last Tuesday, the large cap index ticked 4394 intraday before reversing lower, to end the week down 2.4 percent to 4224. The 200-day (4233) has been breached – albeit slightly.
Bears obviously would love to build on last week’s momentum. This was the first time since March 17th this year the S&P 500 closed before the average. Having lifted off the 200-day two weeks ago, bulls had an opportunity to rally the index to the upper trendline of a descending channel from the July 27th high of 4607 but came up short (Chart 1). The index ended last week at the lower trendline of the channel. Right around there lies the lower bound of an ascending channel from last October when the index bottomed at 3492.
With this, lateral support at 4320s has been decidedly breached. At this stage, bears are probably eyeing 4160s.
Longs’ inability to even rally to the nearest resistance speaks of the current lack of a tailwind that so much helped them early on as the major equity indices bottomed last October. Shorts were actively using ETFs such as SPY (SPDR S&P 500 ETF) as well as futures to build bearish positions but were forced to cover as these indices marched higher (more on this here). This greatly contributed to the upside momentum. It is lacking now.
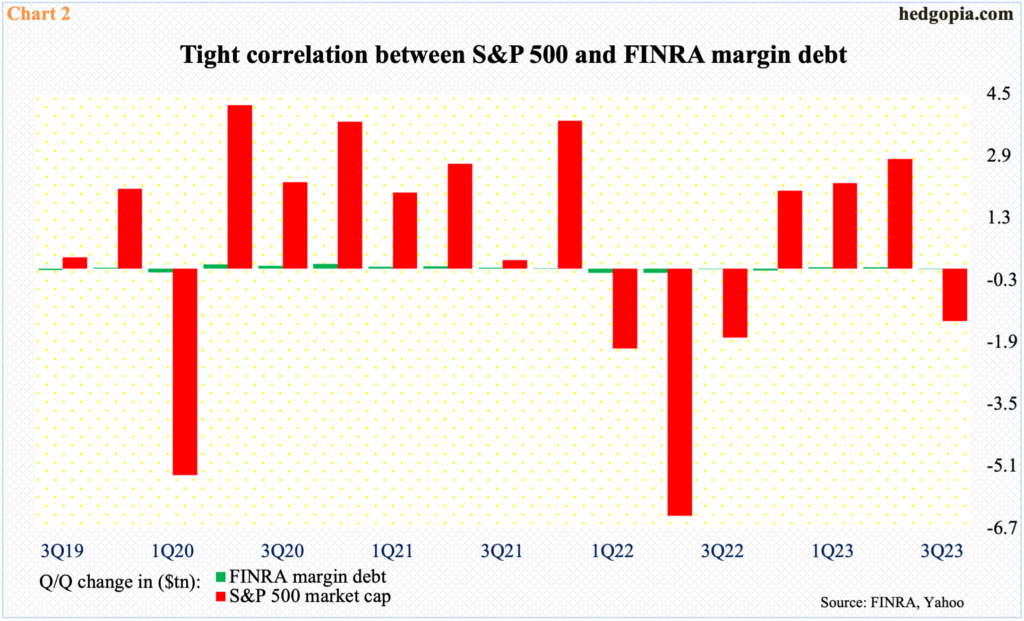
Margin debt falls into the same category. In September, FINRA margin debt declined $8.3 billion month-over-month to $680.8 billion – a four-month low. The metric peaked two years ago in October 2021 at $935.9 billion. The Russell 2000 and the Nasdaq 100 peaked in November that year and the S&P 500 in the following January. These indices bottomed last October, with margin debt bottoming last December at $606.7 billion. It then rose to $709.8 billion this July before coming under renewed pressure. The indices, too, are under pressure since their July highs.
As Chart 2 shows, margin debt correlates strongly with the S&P 500. The problem for equity bulls is that they are not as willing to take on leverage as they were two years ago. In July, the S&P 500 was merely 4.6 percent from its all-time high of 4819 from January 2022, while margin debt was 31.8 percent from its record high of October 2021.
This has been a problem for the bulls. Not only are they less willing to add to debt but there is concurrently less room for short squeeze as zealous shorts are turning tail. This gives the latter an opportunity to show up at the slightest opportunity. This was also evident in the Russell 2000.
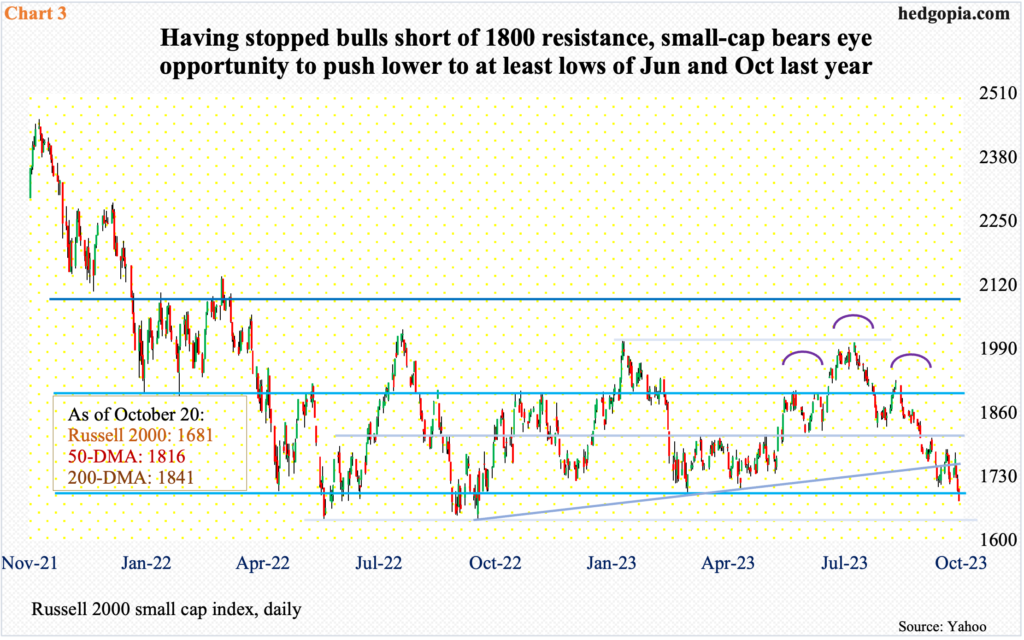
Last week, small-cap bulls were stopped before genuinely testing 1800. On Tuesday, the small cap index ticked 1780 and turned lower. In the week before, they only managed to rally to 1787. As things stand, momentum lies with the bears.
Four weeks ago, the Russell 2000 breached the neckline of a head-and-shoulders pattern at 1800, which also constitutes the midpoint of a range between 1700 and 1900 intact since January last year.
Last week, 1700 was breached, with the index closing at 1681. Bulls can still step up and defend 1640s – the lows of June and October last year (Chart 3). Inability to do so will open the door toward 1600, which is where the head-and-shoulders pattern completes.
Similar dynamics are in play on the Nasdaq 100.
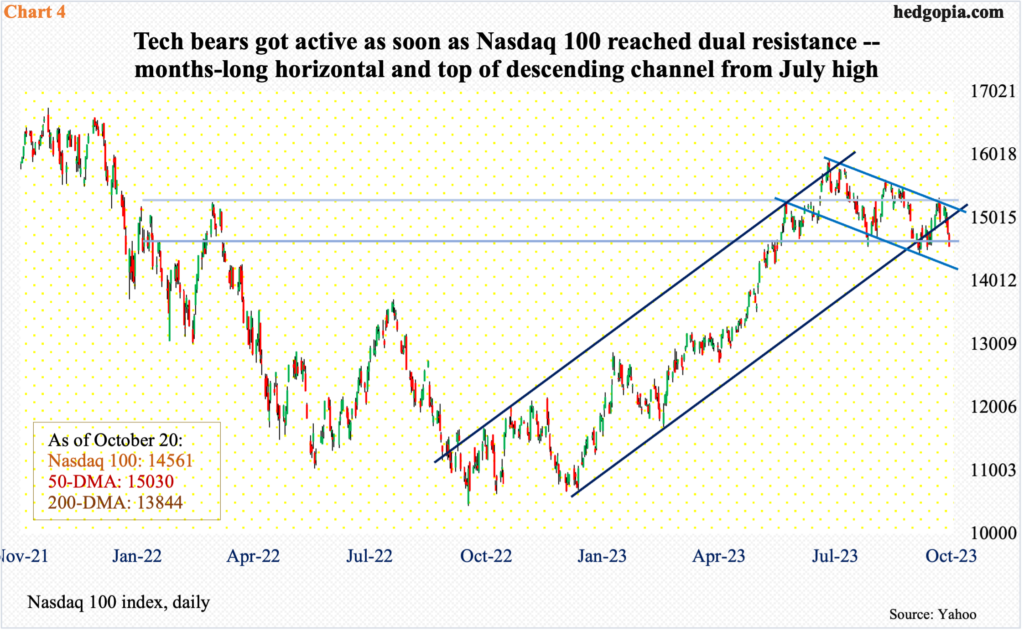
Last week, tech bears showed up at dual resistance. Monday’s high of 15210 kissed horizontal resistance at 15200s, as it did the upper trendline of a descending channel from July’s high (15932), which was a lower high versus the record high of 16765 from November 2021.
After sellers showed up Monday, in each of the next four sessions, the Nasdaq 100 made lower highs, finishing the week at 14561, losing 2.9 percent – the first down week in four. Friday’s 1.5-percent decline cost the bulls straight-line support at 14600s.
Ahead, channel support lies at 14200s (Chart 4), a loss of which will lead the bears to eyeing the 200-day at 13844.
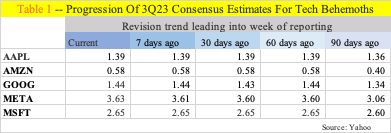
For both tech bulls and bears, this week is particularly important in that several tech majors are due to report their September quarter. Microsoft (MSFT) and Google owner Alphabet (GOOG) report on Tuesday, Facebook owner Meta Platforms (META) on Wednesday and Amazon (AMZN) on Thursday. Apple (AAPL) is scheduled for next week on November 2nd, while Nvidia (NVDA) will report its October quarter on November 21st.
Leading up to this, the sell-side seems to have decent conviction in their estimates for the five companies above. For a couple of months now, the consensus is flattish to slightly up – and comfortably up versus three months ago (Table 1).
The bar probably is low, giving the companies a chance to beat. The stocks have been under pressure, so can react favorably. In this scenario, it is tech bulls’ ball to lose this week.
Thanks for reading!
