
Equity bulls rallied the major US stock indices strongly early last week, but the momentum faded as the week progressed. One of the reasons for this is the lack of potential tailwind coming from heightened bearish sentiment.
Equity bulls are probably not happy with last Friday’s post-earnings reaction to the better-than-expected results from financials for the September quarter. Of the three major banks reporting, JPM (JP Morgan Chase) and WFC (Wells Fargo) were up but finished substantially off the highs, while C (Citigroup) reversed to end in the red.
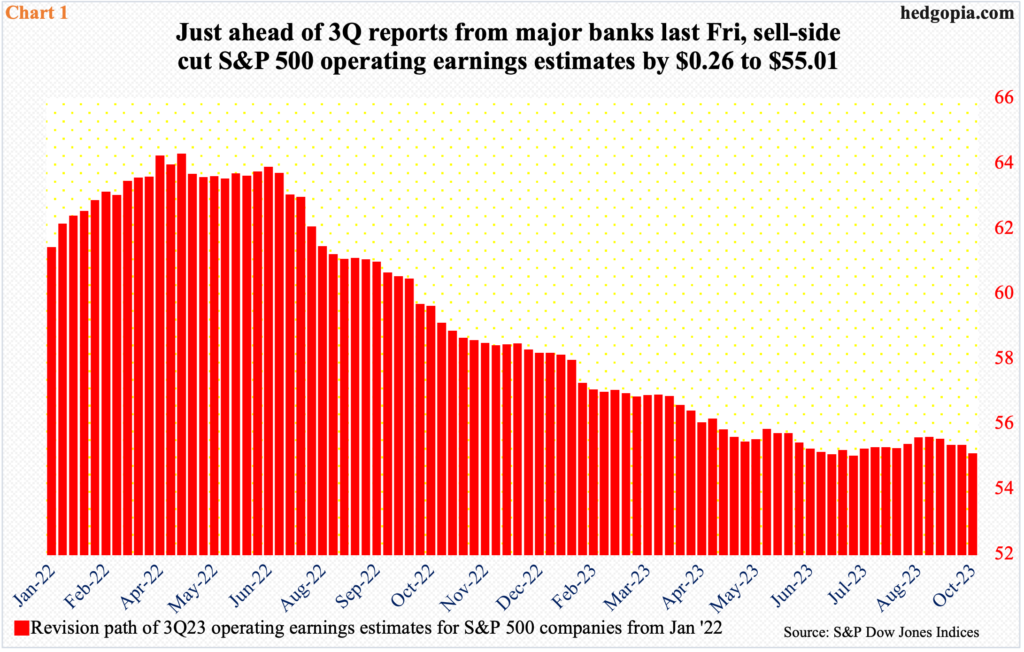
The season is young, and the bar is low. In fact, as of last Tuesday, the sell-side cut its operating earnings estimates for S&P 500 companies by 26 more cents to $55.01, which was just about flat with the $54.98 expected as of July 11th this year. As of April 27th last year, these analysts were penciling in $64.21 before they brought out the scissors (Chart 1).
At the end of the June quarter, the sell-side expected $52.30 for the second quarter, and by the time the reporting season was over, the S&P 500 companies ended up earning $54.84, with the blended numbers beginning to get upwardly revised in late July. The S&P 500 peaked on July 27th.
For the September quarter, the bar customarily is low. Longs obviously are hoping last Friday’s reaction to banks’ earnings is not a sign of things to come.
The difference between July and October is that there was no geopolitical tension in the Middle East back then. There is now. Investors will find it difficult to only focus on earnings and not get swayed by what is transpiring in the Middle East. Last week was a testament to this.
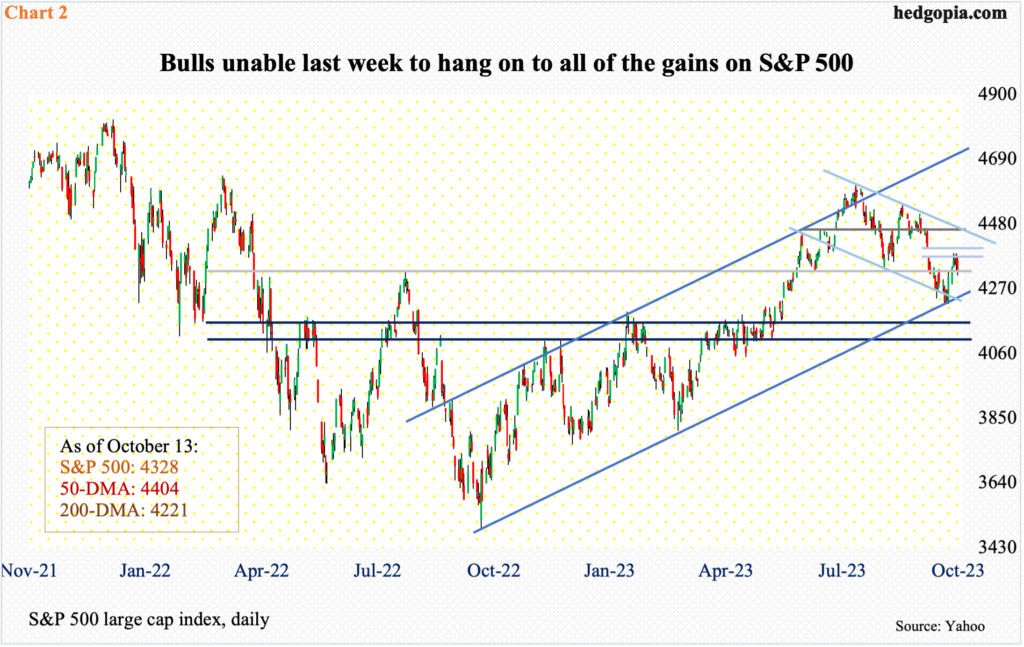
After going sideways just above the 200-day for a couple of sessions, the S&P 500 lifted off the average on the 6th (Friday). The momentum continued in the following Monday and Tuesday (last week), but only to then hit the wall.
At last Tuesday’s high, the large cap index was up 1.8 percent for the week. By Friday, the gains were reduced to 0.45 percent. Sellers showed up Thursday at Tuesday’s high (4385). A gap from September 21st would have filled at 4400 (Chart 2). That did not quite happen. The 50-day at 4404 was just above. And there was channel resistance at 4450s, with the S&P 500 trading in a descending channel since it retreated on July 27th at 4607.
The index (4328) closed last week right at 4320s support, which likely gives way in the sessions ahead. The 200-day lies at 4221.
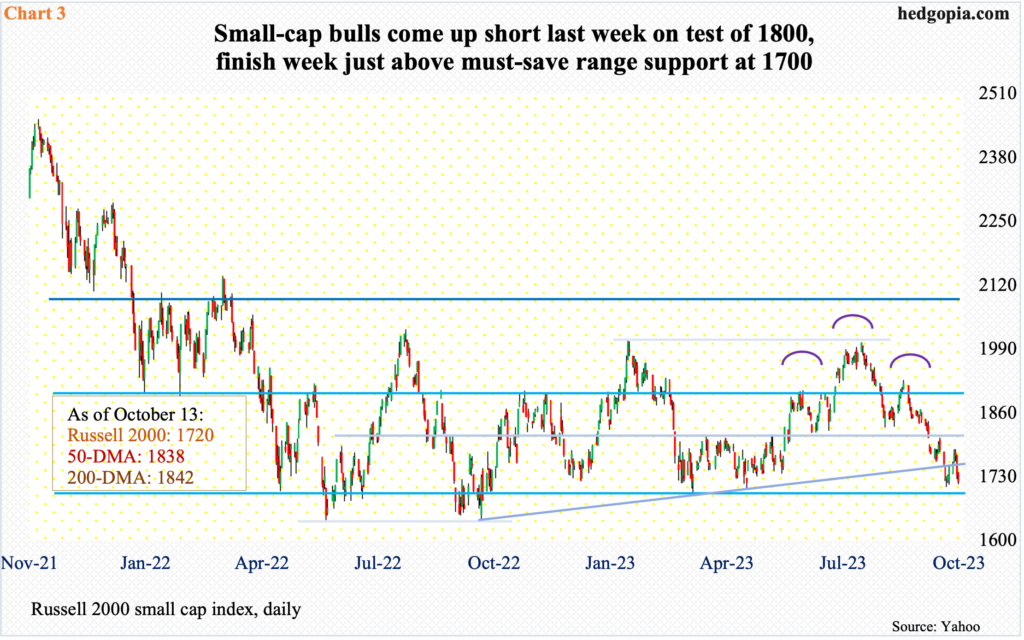
Large-caps stalled in the middle of the week last week, but small-caps have been acting sick for a while. With a larger exposure to the domestic economy, small-caps are treated as a means to take the pulse of the economy. And they are not sending an encouraging message.
Last week, the Russell 2000 closed down 1.5 percent to 1720. Going back to January last year, the small cap index has been rangebound between 1900 and 1700. The midpoint of the range – 1800 – also constitutes the neckline of a head-and-shoulders pattern, which was broken four weeks ago (Chart 3). If the pattern completes, downside risk lies at 1600. But for that, 1700 needs to yield. The way small-caps are behaving, this is likely to happen in the sessions ahead.
Equity bulls currently are seriously lacking the potential support coming from bearish investor sentiment.
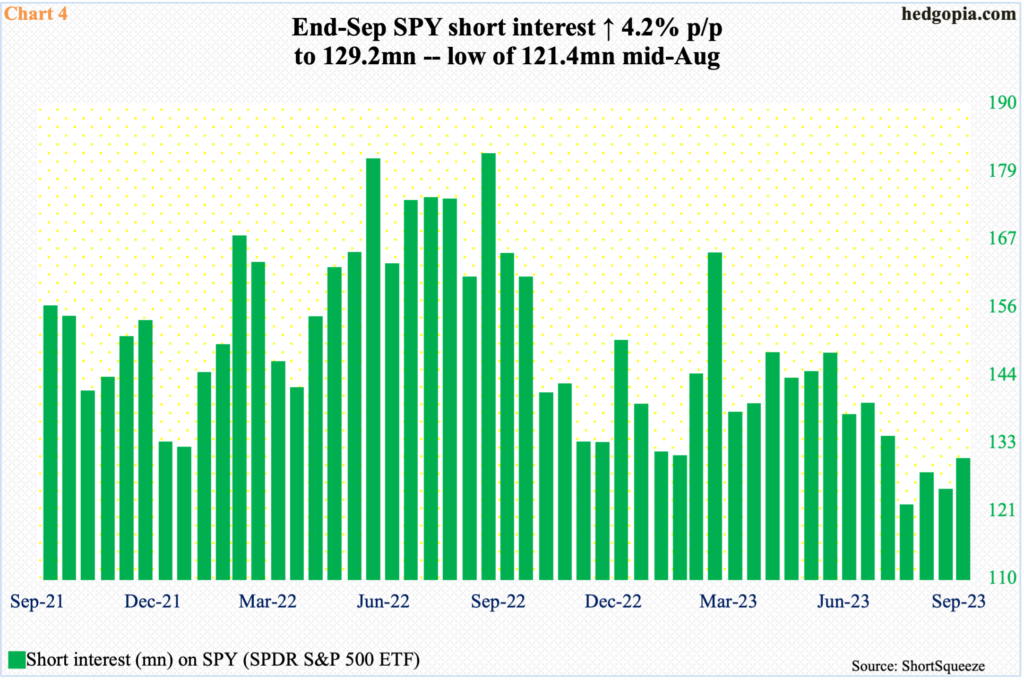
Mid-September last year, short interest on SPY (SPDR S&P 500 ETF) jumped to 180.5 million, which was the highest since end-February 2021. After dropping from 4819 in January last year, the S&P 500 bottomed at 3492 in October. The rally that followed was immensely helped by the unwinding of the bearish sentiment that prevailed at the lows.
As shorts turned tail and covered, SPY short interest then declined all the way to 121.4 million mid-August this year. The S&P 500 peaked in late July at 4607, before dropping to 4216 by the 3rd this month. Last week’s rally attempt fell just shy of 4400. One of the reasons for a lack of momentum is the lack of short-interest tailwind. At the end of September, SPY short interest rose 4.2 percent period-over-period to 129.2 million, but remains low (Chart 4). It is clearly not helping.
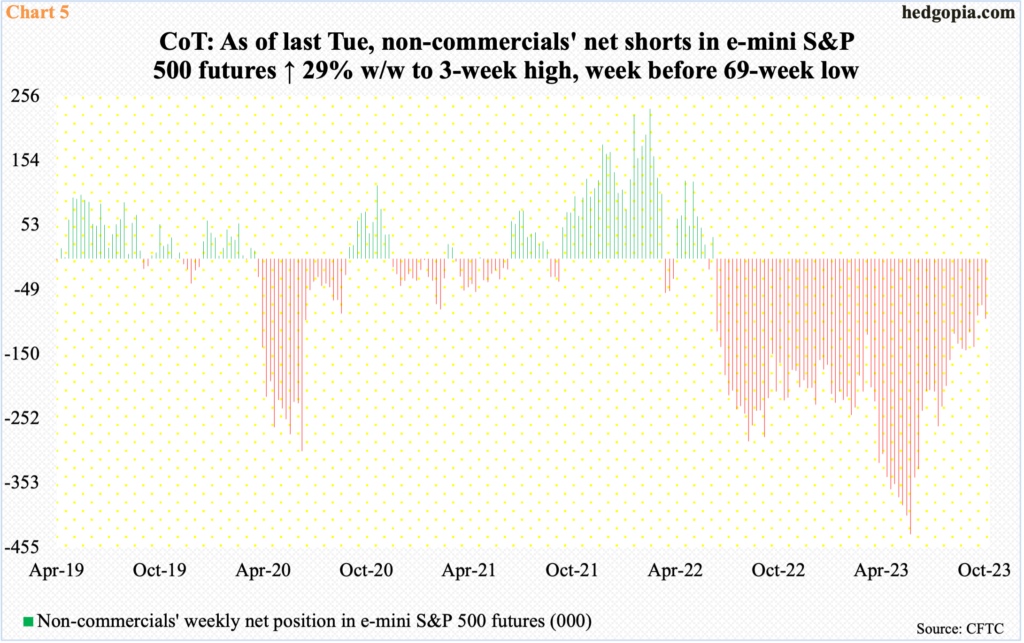
The dynamics are similar in the futures market. In the week to October 18th last year, non-commercials owned 223,198 contracts in net shorts in e-mini S&P 500 futures. As the cash began to rally, this was cut down to 119,819 by the week to March 14th, before these traders began to load up on them. They were obviously not convinced that the mid-March low in the S&P 500 was sustainable. By May 30th, they had accumulated a record 434,170 contracts. On May 4th, the S&P 500 bottomed at 4048, before just about going parabolic through the July 27th high. Non-commercials, in the meantime, had no option than to cover – which in and of itself contributed to the upside momentum in the cash. By the 3rd this month, they had reduced their net short exposure to 73,235, which in the subsequent week rose to 94,449 (Chart 5) – not enough to potentially amount to a tailwind for the cash.
In the current circumstances, bearish sentiment needs to build up before it gets to a level where unwinding becomes the path of least resistance. Sentiment is not there currently.
Thanks for reading!
