On the eve of 1Q19 earnings season, the Russell 2000 sits right underneath short-term trend-line resistance. After this lies crucial 14-month horizontal ceiling. How non-commercials position themselves this week could leave clues as to how the index might fare in the next few weeks.
Year-to-date, the Russell 2000 small cap index is up 15.7 percent, matching the performance by the S&P 400 mid cap index. Both the S&P 500 large cap index and the Dow Industrials are lagging with rallies of 14.6 percent and 12.4 percent respectively. The Nasdaq composite is ahead with a 19-percent jump.
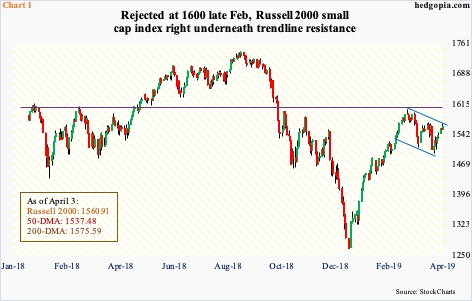
Along with tech, small-caps are considered risk-on. They have lagged their peers for several weeks now. Unlike all of its afore-mentioned peers, the Russell 2000 is still below its 200-day moving average. Late February this year, it was denied at 14-month horizontal resistance just north of 1600 and is still smarting under that rejection (Chart 1). This created some trading opportunities.
Since that denial, the index has traded within a descending channel. Wednesday’s high kissed the upper bound, but no breakout yet. The formation could also be viewed as a potentially bullish flag. A breakout opens the door for a test of the 200-day moving average, which at 1575.59 is right above, followed by 1600-plus. What happens here could decide which way the index goes in at least the next few weeks.
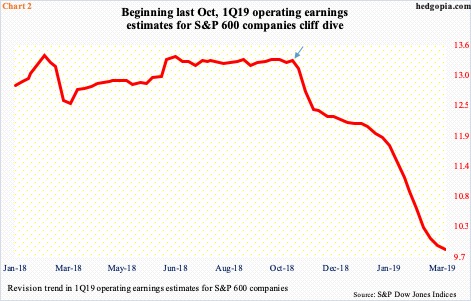
The 1Q19 earnings season begins in earnest next week. Going into all this, the bar is low. The sell-side was unrealistically optimistic last year and as a result has been forced to aggressively reduce estimates. Operating earnings estimates for S&P 600 companies peaked as far back as February last year at $13.42 but it was not until October last year they fell off the cliff (arrow in Chart 2). As of March-end, these companies are expected to earn $9.85 in the just-concluded quarter. In 1Q18, earnings were $9.14 and $9.70 in 4Q18.
The sell-side expects earnings momentum to pick up speed in the remaining three quarters, with expectations of $12.87 in 2Q, $14.03 in 3Q and $15.52 in 4Q. If these estimates come through, 2019 would have grown 34.1 percent to $52.27. This would have come after a 25-percent rise last year. The momentum is expected to continue into 2020 with a 25.2-percent increase to $65.45. Markets do not quite buy this enthusiasm. The Russell 2000 (1560.91) is still 10.4 percent below its all-time high of 1742.09 from last August.
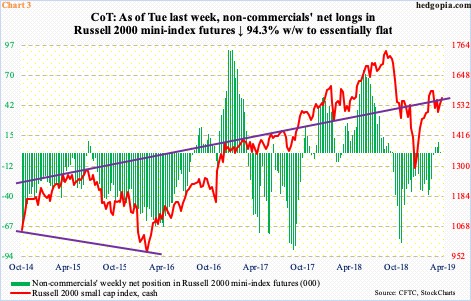
But 1Q19 is another story. The earnings hurdle is low. This week’s non-commercials’ position in Russell 2000 mini-index futures might give us some clues as to how small-caps might fare in at least the next few weeks as these companies report earnings.
Early February, these traders were net short just north of 38,000 contracts, before cutting back and eventually going net long early March. As of Tuesday last week, they were about flat, not willing to bet one way or the other.
In a scenario in which non-commercials start building net longs and the cash breaks out of the afore-mentioned resistance, a self-fulfilling prophecy has a chance to trigger elsewhere.
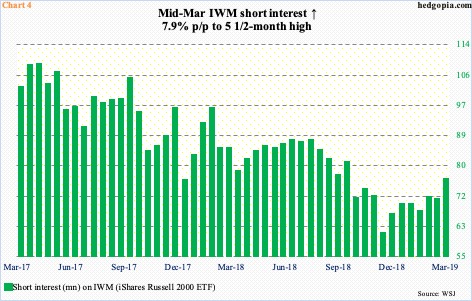
As of mid-March, short interest on IWM (iShares Russell 2000 ETF) rose 7.9 percent period-over-period to 76.1 million shares. This is not that crazy elevated, but at a five-and-a-half-month high, is decent enough to potentially cause a mini squeeze, which might occur should the Russell 2000 rally past 1600-plus. The next few sessions in this regard are worth watching.
Thanks for reading!

