
From trade disputes to declining corporate profits to yield-curve inversion, there is no shortage of issues for worrywarts to worry about. From recent highs, major US equity indices have dropped in the mid- to high-single digits. Medium term, more downside is the path of least resistance. Near term, a relief is possible, although there are no reversal signs yet.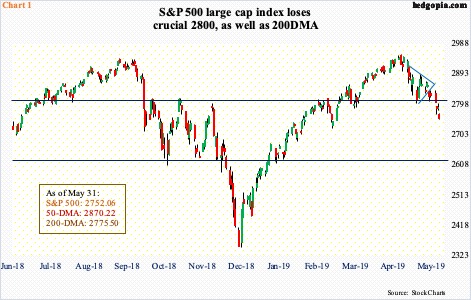
Stocks in general began retreating from early May. From the all-time high of 2954.13 on May 1 through last Friday’s low, the S&P 500 large cap index (2752.06) fell 6.9 percent. Similarly, between the all-time high of 7851.97 on April 25 and last Friday’s low, the Nasdaq 100 index dropped 9.2 percent. The Russell 2000 small cap index peaked a lot earlier – on August 31 last year at 1742.09 – declining 16.1 percent through last Friday’s low; from early May, it is down 9.7 percent.
Early May, an overbought market did not take well the May 5th President Donald Trump tweet announcing the 10-percent levy on $200 billion in Chinese goods would increase to 25 percent. Then came the May 30th tweet threatening to impose a five-percent tariff on all goods coming from Mexico beginning June 10; the day after, the afore-mentioned indices, as well as others, fell to the lows of the year.
Last week, the S&P 500 not only lost 2800 (Chart 1), which has proven to be an important price point going back to March last year, but also the 200-day moving average. Medium- to longer-term, the path of least resistance is down. Near term, several indicators have been pushed into oversold territory. A relief is possible. Both bulls and bears are probably watching for reversal signals to position accordingly near term.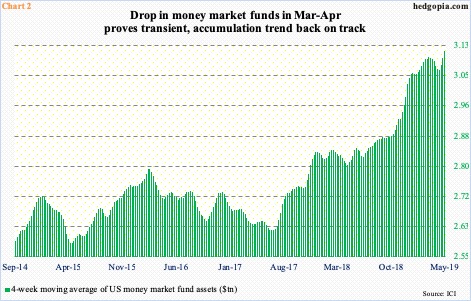
Should a relief rally ensue, bulls’ first objective is to reclaim the 200-day, and after that 2800. The latter in particular is the line in the sand. Bulls hope a takeout of this resistance leads money-on-the-sidelines begins to find its way back into equities.
Money-market assets continue to accumulate (Chart 2). As of last Wednesday, they were up $18 billion week-over-week to $3.15 trillion – the highest since February 2010. These are massive numbers and have the potential to provide a tailwind to equities as and when money parked in these funds begins to leave. This has been the case historically.
With that said, this time around, money continued to move into these funds even after stocks bottomed last December after a three-month decline. Since the week to December 26 through last week, these funds have gone up by $109.5 billion.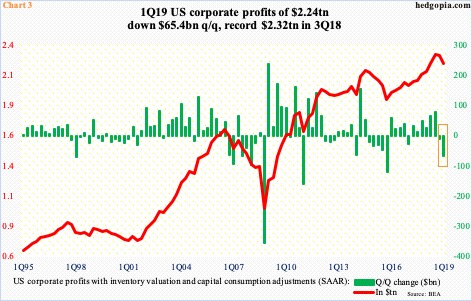
As mentioned earlier, for someone looking for reasons to get cautious, there is plenty.
Last week, US corporate profits for 1Q19 were released. Profits with inventory valuation and capital consumption adjustments fell a massive $65.3 billion quarter-over-quarter to a seasonally adjusted annual rate of $2.24 trillion. This was the second straight quarterly decline. In 4Q18, profits fell $9.7 billion. The back-to-back decline came after six straight quarters of growth (box in Chart 3). The metric peaked at $2.32 trillion in 3Q18.
Profits have come a long way. Since bottoming at $1.02 trillion in 4Q08, they rose 128 percent before peaking two quarters ago. Noticeably, within this up cycle, profits fell for five straight quarters beginning 4Q14. Given that the economic cycle is a month short of completing a decade, in a worse-case scenario, the current downtrend trend could last a while. At least that is how the cautionary types likely think.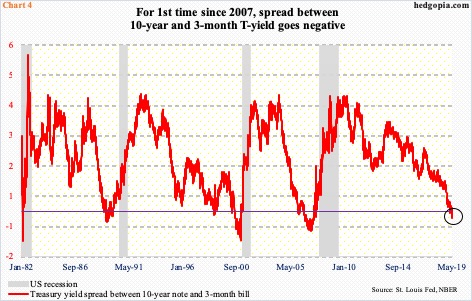
Chart 4 lends credence to this caution.
Recently, parts of the Treasury yield curve have inverted. Traders pay particular attention to the spread between yields on 10-year notes and three-month bills. Inversion occurs as demand for longer-term bonds goes up in fear of tough times in the economy.
For the first time since 2007, the spread between the two went negative on March 22. After that, this occurred 12 more times, including the last six sessions.
Currently, demand for 10-year notes is solid, with Friday’s yield of 2.14 percent the lowest since September 2017. Six sessions ago, it sliced through support at 2.36 percent. Building on that mini-breakdown, yields dropped 18 basis points last week. A major breakdown occurred mid-March this year when 2.62 percent, which goes back a decade, gave way.
For now, the September 2017 low of two percent is the most relevant reference point. The 10-year bottomed at 1.34 percent in July 2016, but since peaking at 3.25 percent last October, a pattern of lower highs and lower lows is intact.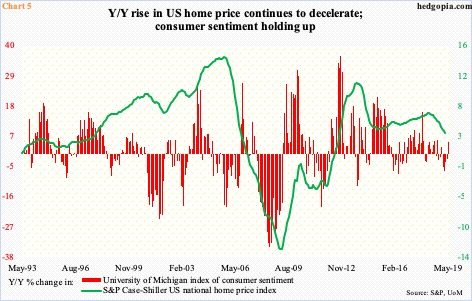
Macro data is mixed at best. The jobs picture is decent, but this cannot be said of every facet of the economy. For several months now, sales of both existing and new homes are flat to down – the former in particular. Prices are holding up, but even here the rate of appreciation is in deceleration. Home prices tend to impact consumer psyche, hence their spending.
The S&P Case-Shiller US national home price index rose 3.7 percent year-over-year in March. As recently as March last year, prices were rising at a 6.5 percent clip. Since then, they fell every month (Chart 1). The longer this persists, the higher the odds this will begin to adversely impact consumer sentiment. The latter for now is holding up – even diverging. May sentiment rose 2.8 points month-over-month to 100. The 101.4 in March last year was the highest since January 2004.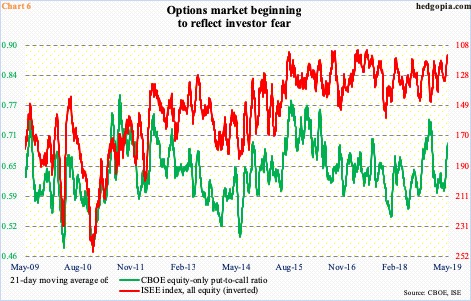
If all these negative data points are causing the prevailing selloff, it arguably is in the price – at least some. This in the right circumstances also means room for a reflex rally. Some metrics are beginning to look way stretched.
Chart 6 plots the 21-day moving average of the CBOE equity-only put-to-call ratio and the ISEE index, all equity. The latter is a call-to-put ratio, hence inverted. It excludes trades from market makers and brokers/dealers, and only uses opening long trades. In general, the ISEE index is considered a cleaner of the two. Both these metrics are beginning to reflect fear currently. The ISEE index, as a matter of fact, is not that far away from its record lows. The CBOE put-to-call ratio ended last Friday at 0.6968. Historically, it has shown a tendency to revert from high-0.60s/low-0.70s. When that happens, equities go the other way.
There is this, though. Last December, the S&P 500 bottomed on Boxing Day. One trading session before that, on Christmas Eve, the green line in the chart peaked at 0.7443, which is what led the foundation for the massive rally in the S&P 500 that followed. Should the ratio continue higher, stocks likely continue lower.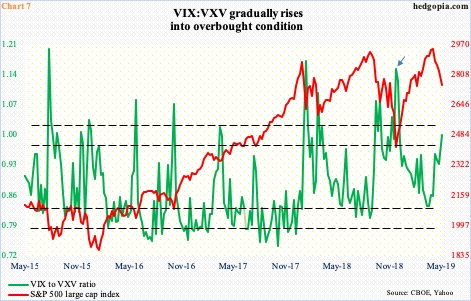
This is a scenario that can also unfold in Chart 7, which pits the ratio of VIX to VXV against the S&P 500. VIX measures market’s expectation of 30-day volatility using S&P 500 options. VXV does the same, except it goes out to three months. When traders/investors are in risk-off mode, demand for nearer-term protection goes up, which gets reflected in the ratio, as VIX rises more than VXV. The opposite occurs when sentiment shifts to risk-on.
Currently, the ratio, which ended Friday at 0.99, already is at a level where several times in the past a reversal has occurred. When that happens, equities rally. At the same time, the ratio is not at a washout level as was the case late December (arrow). Hence the need to be on the lookout for reversal signals in major equity indices.
Bulls’ worse-case scenario is continued weakness until the S&P 500 drops to 2600-2650. Should instead a reversal occur, and the index rallies, what transpires at 2800 will decide which way momentum shifts near term.
Thanks for reading!
