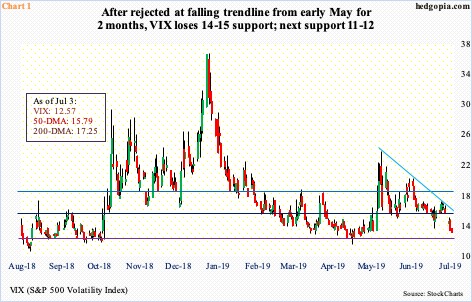
VIX this week broke two-month support, opening the door to a test of support at 11-12. Meanwhile, the volatility curve – in contango – is approaching a level that in the past coincided with a peak in stocks.
With one session to go, volatility took it on the chin this week. VIX is down 16.6 percent. The S&P 500 large cap index is up 1.8 percent to a new high.
In February last year, VIX (12.57) spiked to 50.30 intraday before reversing. The drop since found support at a higher level – 11-12 rather than the previous 9-10. (VIX made an all-time low of 8.56 in November 2017.) Last December, the volatility index once again retreated after surging to 36.20 intraday (Chart 1). Since that high, 11 was once tested mid-April, even as 14-15 provided support in May-June. This week, that support gave way, opening the door to a test of 11-12.
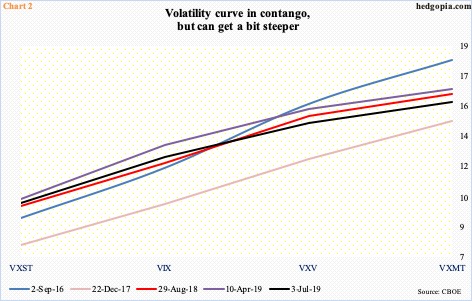
Volatility is under pressure, and premium is coming out of the shorter end of the curve faster than the long end. VIX measures expectations for 30-day future volatility using S&P 500 options. VXST does the same but only goes out to nine days, VXV 90 days and VXMT six months. The volatility curve is in contango currently.
Chart 2 plots four other instances going back to September 2016 in which the curve slopes upward to the right, as is the case now. As of Wednesday, the spread between VXST and VXMT was minus 5.83. There is room for it to get a bit steeper, which can happen in the sessions ahead if the short-end continues to lose premium faster.
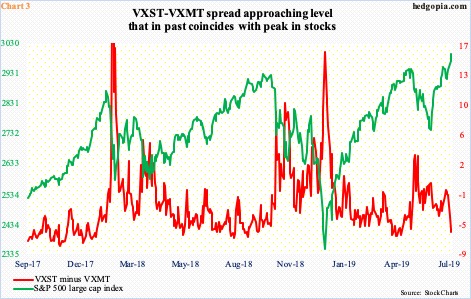
Another way of looking at this dynamic is presented in Chart 3. The current VXST-VXMT spread is nearing a level that several times in the past coincided with a peak in the S&P 500. The odds of this happening again rise the longer the red line goes sideways, especially if the spread rises to minus six to seven.
Along the same lines, once 11-12 is tested on VIX, odds begin to rise it stabilizes. Then, unwinding just becomes a matter of when, not if. It is getting closer.
Thanks for reading!

