Small-caps are lagging. With a large domestic exposure, these companies offer a reliable way to take a pulse of the economy. Rates have gone up a lot and will rise even more. A recession is imminent next year. Large-caps’ recent outperformance is illusory.
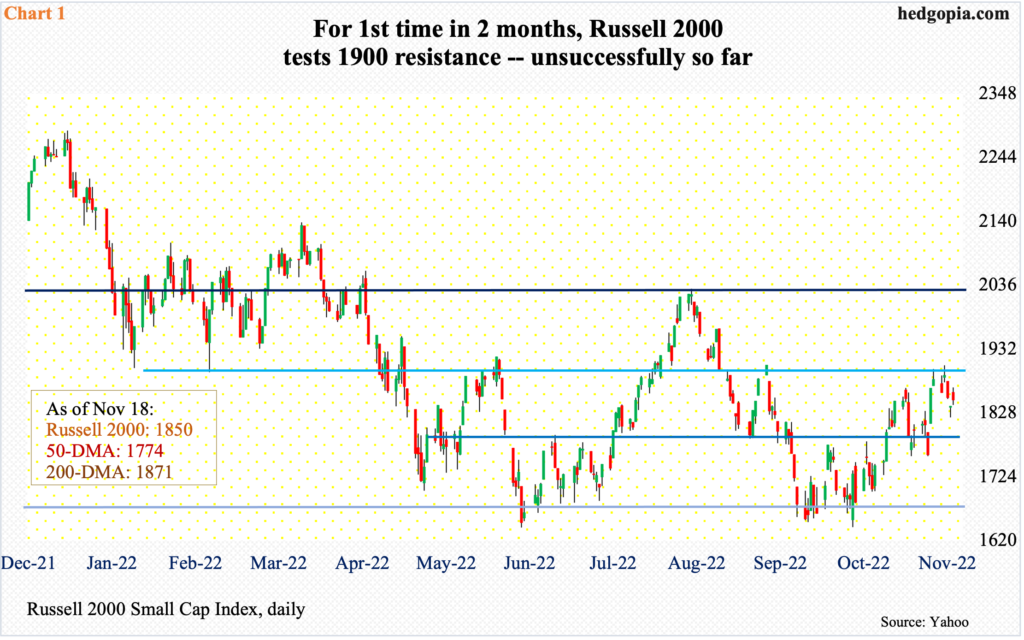
The Russell 2000 is getting rejected at 1900, which represents the top of the recent range.
The small cap index has been bobbing up and down within several ranges for a while now. It peaked last November at 2459 and then dropped all the way to 1642 by October 13 this year. A major breakdown occurred mid-January, losing 2080s; leading up to that, it went back and forth between 2080s and 2350s for 10 months, then seesawed between 2080s and 1900, followed by a ping pong match between 1900 and 1700; 1700 is where it broke out of in November 2020.
The rally that followed the October low tested 1900 on the 11th this month; this was a first test of the level over a couple of months. The test failed with a shooting star right on the resistance. Then, a long-legged doji showed up last Tuesday (Chart 1).
The index (1850) is now under the 200-day moving average (1871), with the 50-day at 1774. Bears are likely eyeing 1800 near term.
Small-caps inherently have a larger exposure to the US economy versus their large- and mid-cap peers. So, when domestic prospects are good, investors tend to gravitate toward small-caps, which are therefore viewed as a risk-on barometer.
The Russell 2000’s inability to recapture 1900 in this respect is important. This does not speak very highly of where the US economy is headed in the quarters to come.
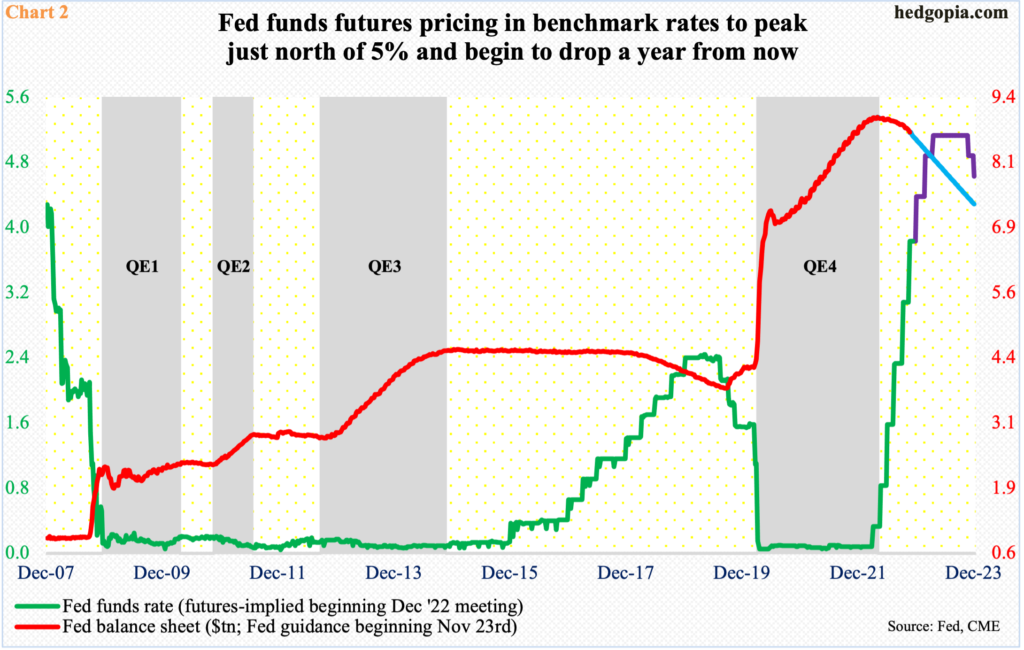
Interest rates have gone up sharply. The benchmark fed funds rate – at a range of zero to 25 basis points until March this year – was raised by 75 basis points to a range of 375 basis points to 400 basis points early this month. In all probability, these hikes are yet to filter through to the economy. Plus, the Federal Reserve is also reducing its bloated balance sheet (Chart 2).
Plus, rates are still headed higher. In the December (14-15) meeting, futures traders expect the Fed to raise by another 50 basis points, expecting the fed funds rate to settle just north of five percent by the early months of 2023, go sideways for several months and then begin to decrease by the end of the year.
Inflation remains elevated. For the central bank to begin to cut in the latter months of next year, the economy has to be suffering massively. Alternatively, in order to control inflation, the policymakers will keep the benchmark rates at an elevated level, which will no doubt bite the economy. Either way, it is a no-win situation.
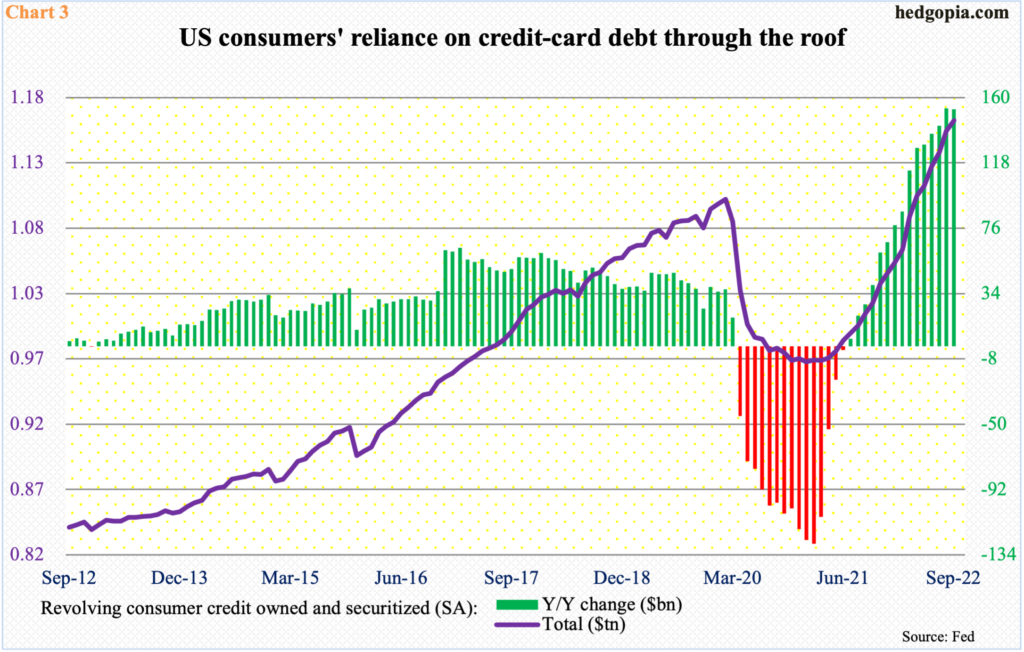
This is coming at a time when consumers are gorging on debt.
In September, consumer credit set a new record – $4.7 trillion, up from $4.4 trillion from a year ago, for an increase of 7.9 percent. Of this, revolving credit was $1.2 trillion, up 15.1 percent y/y, and non-revolving $3.5 trillion, up 5.8 percent y/y.
Non-revolving credit cannot be used again once it is paid off. Student and auto loans, or home mortgage, for instance. Revolving credit, on the other hand, is a line of credit that one can tap into any time. Credit cards are the best example.
Chart 3 highlights the pace at which revolving credit has been accumulating over the past several months. This is taking place at a time when rates have risen meaningfully and will rise even more in the months to come.
A recession is only a matter of time.
If small-caps are sending an ominous message about next year’s prospects, then the current large-cap outperformance cannot be trusted.
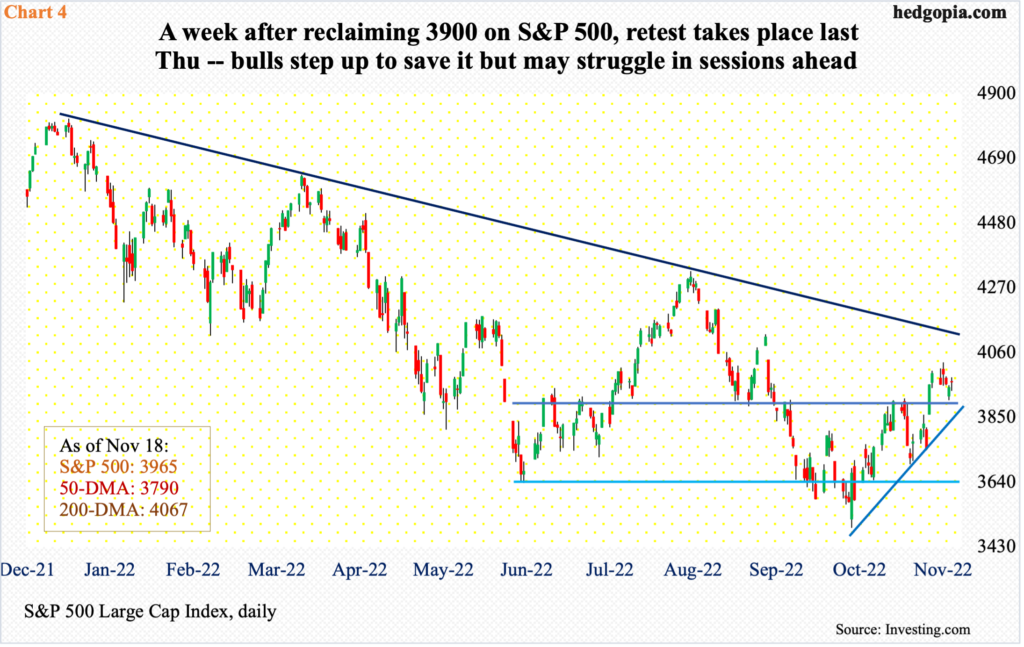
The S&P 500 large cap index shed 0.7 percent last week; in the prior week, it jumped 5.9 percent. In contrast, the Russel 2000 decreased 1.8 percent and increased 4.6 percent, in that order.
Despite outperforming the Russell 2000, large-cap bulls failed to hang on to the gains last week. By Tuesday’s intraday high of 4029, the S&P 500 was up 0.9 percent for the week before sellers showed up; in the end, it lost 0.7 percent. Bulls can take solace in the fact that 3900 drew bids on Thursday as the index ticked 3907 intraday, ending the week at 3965 (Chart 4).
Odds favor a breach of 3900 in the sessions ahead. This will also have breached a rising trend line from last month when the index bottomed at 3492. A spinning top showed up on the weekly last week, with several technical indicators right at the median. Bears could get active here.
Traders aside, there are plenty of reasons for long-term investors to wanting to wait. In a scenario in which a recession seems inevitable next year, 2023 S&P 500 earnings estimates are way elevated.
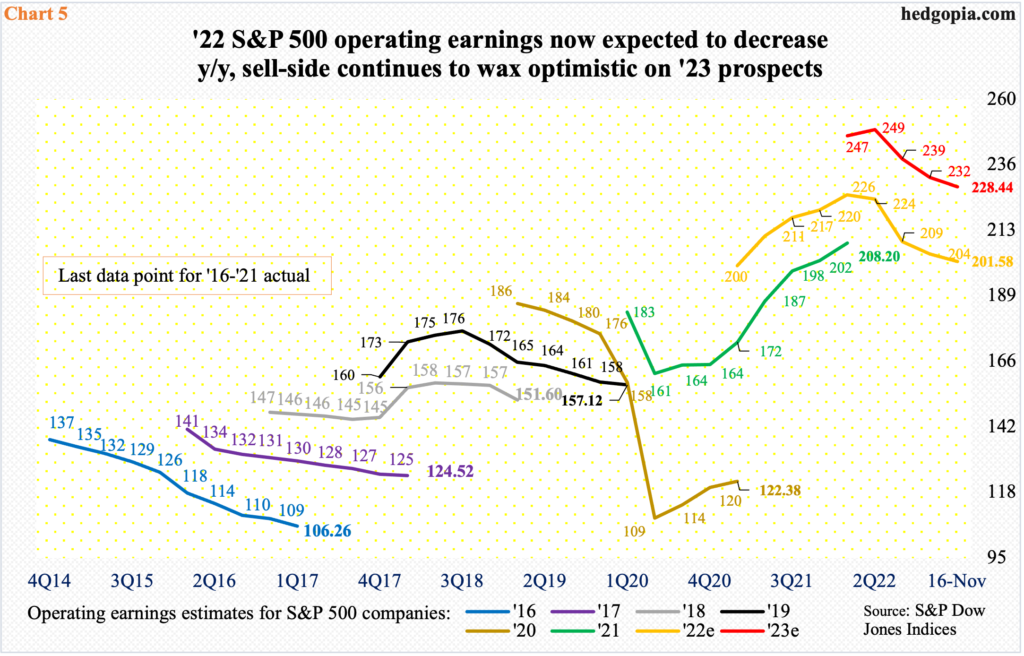
This year, earnings are on pace to shrink from last year’s – albeit slightly (Chart 5). In 2021, these companies took home $208.20. As of last Wednesday, this year was expected to come in at $201.58. In April this year, the sell-side expected these companies to earn as much as $227.51, before reality gradually sunk in.
These analysts tend to lean optimistic. They customarily have not lost hope on next year – which is what typically happens. They start out optimistic and gradually lower the numbers as the year progresses.
In April, next year was expected to come in at $250.12, which has now been revised lower to $228.44, but this still equates to growth of 13.3 percent, which is hard to swallow, given that the probabilities of a recession next year are very high.
This then brings us to the issue of multiples.
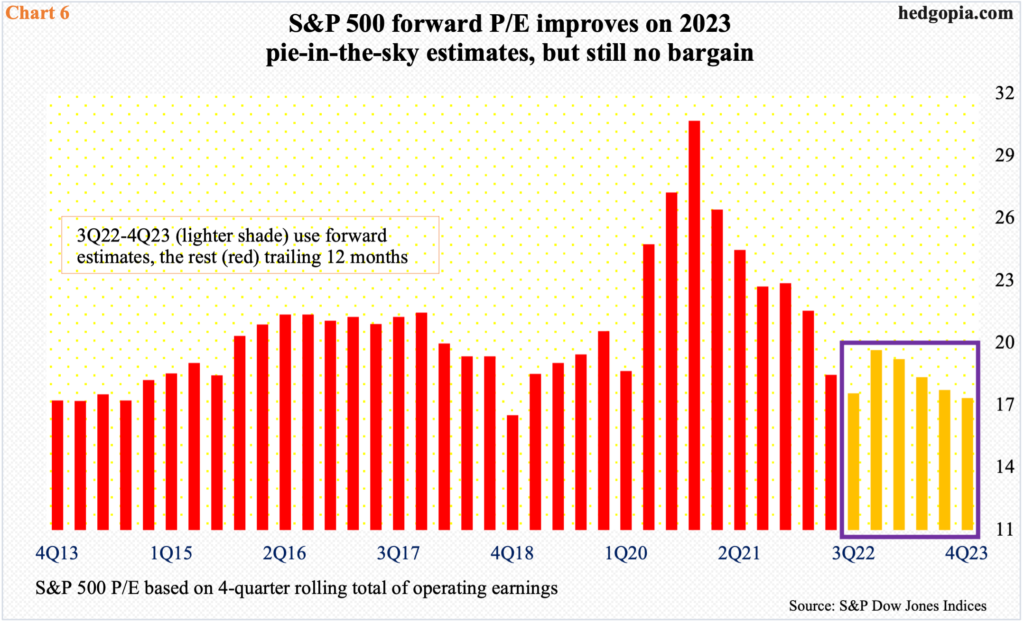
In Chart 6, the price-to-earnings ratio for the S&P 500 is calculated using a four-quarter total of operating earnings. Until 2Q22 – all the red bars – trailing 12 months are used, meaning earnings that have already been realized. Beginning 3Q22 through 4Q23, sell-side estimates are used.
Even using the pie-in-the-sky estimates for next year, the S&P 500 currently trades at 17.4x – not cheap by any stretch of the imagination. This is not an attractive proposition for particularly value investors.
Thanks for reading!

