
Following futures positions of non-commercials are as of October 15, 2024.
10-year note: Currently net short 865.1k, down 95.1k.
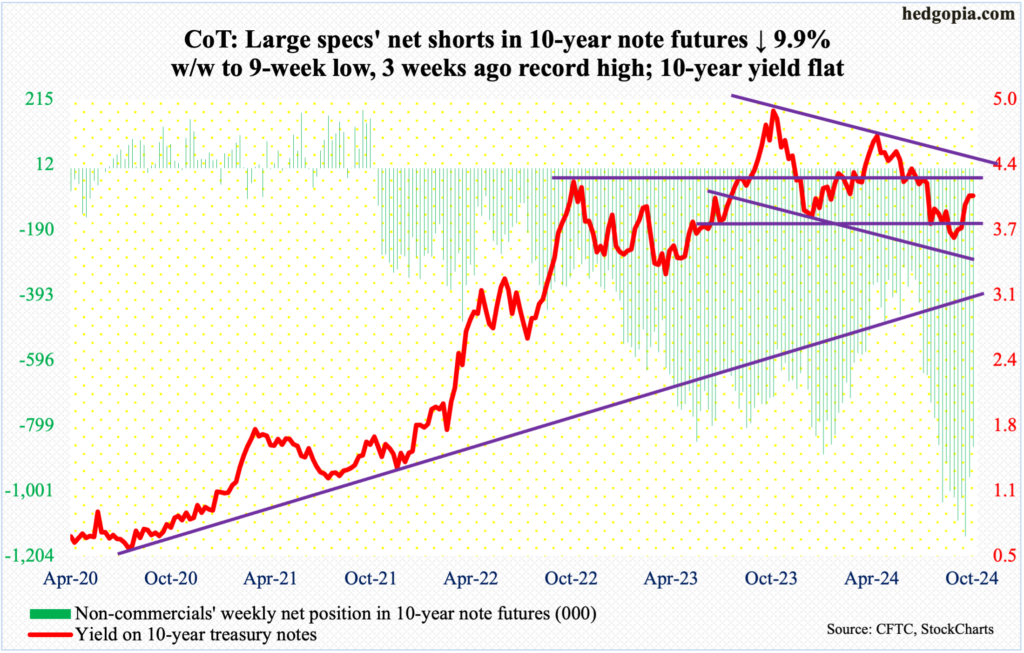
In the week to October 1, non-commercials were net short a record 1,143,889 contracts in 10-year note futures. In the subsequent two weeks, they reduced their holdings by just under one-fourth, to 865,065 contracts.
On October 1, the 10-year treasury yield ticked 3.7 percent intraday before closing at 3.74 percent. It had earlier dropped to 3.6 percent on September 17, having peaked at five percent last October.
After the September-October lows of this year, rates went all the way to 4.12 percent by the 10th this month, rallying even as non-commercials were cutting their net shorts. In normal circumstances, short-covering should have resulted in lower yields, thanks to an inverse relationship between price and yield.
This week, the 10-year rate was flat at 4.07 percent, and it could come under additional pressure at least near term, as some of the daily overbought condition gets unwound.
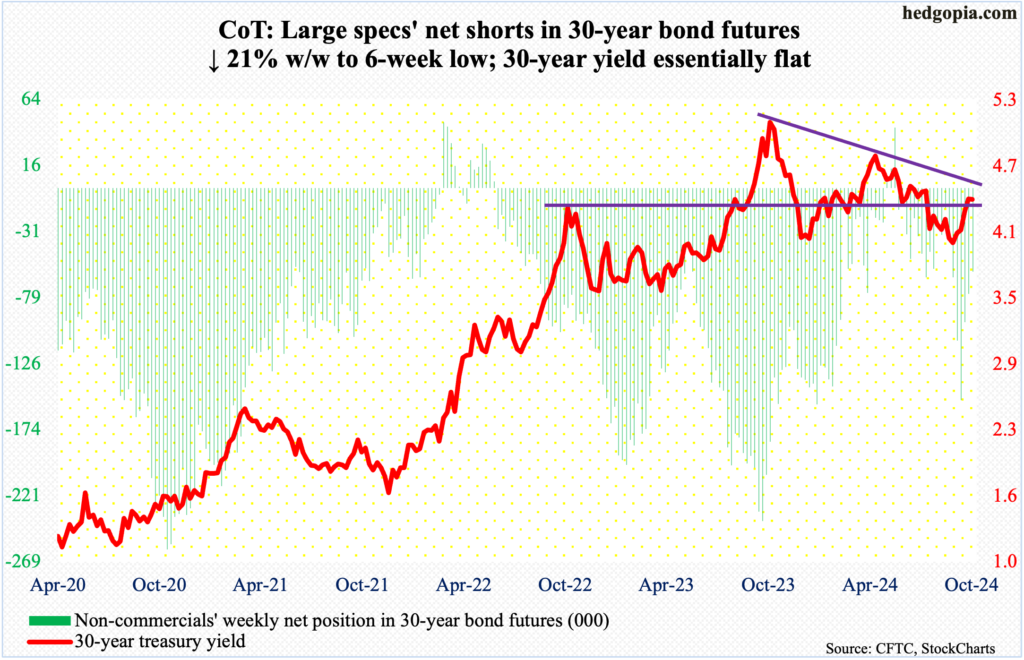
30-year bond: Currently net short 60.2k, down 16k.
Major US economic releases for next week are as follows.
Existing home sales (September) are on schedule for Wednesday. August sales were down 2.5 percent month-over-month to a seasonally adjusted annual rate of 3.86 million units – a 10-month low.
New home sales (September) will be released Thursday. In August, sales declined 4.7 percent m/m to 716,000 units. July’s 751,000 was the highest since February 2022.
Friday brings durable goods orders (September) and University of Michigan’s consumer sentiment index (October, final).
Orders for non-defense capital goods ex-aircraft – proxy for business capex plans – increased 0.3 percent m/m in August to $73.7 billion (SAAR). An all-time high of $74 billion was hit last December.
October’s preliminary reading showed consumer sentiment dropped 1.2 points m/m to 68.9. March’s 79.4 was the highest since July 2021.
WTI crude oil: Currently net long 154.2k, down 576.
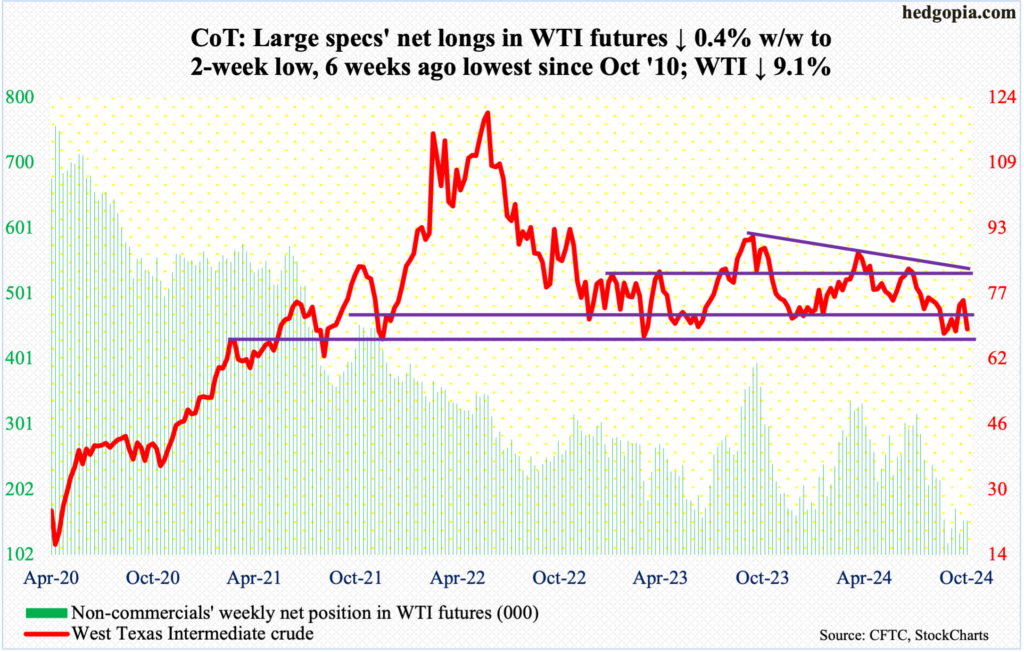
“For now, supply keeps flowing, and in the absence of a major disruption, the market is faced with a sizable surplus in the new year,” the International Energy Agency said in its monthly report on Tuesday. A day earlier, OPEC lowered its demand projections. Plus, it was becoming clearer that Israel was less likely to strike Iranian oil targets.
On Tuesday, West Texas Intermediate crude tumbled 4.4 percent, also breaching its 50-day moving average.
Last week, the crude rose as high as $78.46 intraday Tuesday, before losing steam and reversing hard lower. There was trendline resistance at $80, representing a falling trendline from September last year when the crude retreated after posting $95.03. In addition, the crude has been rangebound between $71-$72 and $81-$82 for months now.
On September 10, WTI touched $65.27, followed by a higher low of $66.33 on the 1st this month. These lows can get tested in the sessions ahead. This week, the crude gave back 9.1 percent to $68.69/barrel.
In the meantime, US crude production in the week to October 11 increased 100,000 barrels per day week-over-week to 13.5 million b/d – a fresh record. Crude imports decreased 710,000 b/d to 5.5 mb/d. Stocks of crude, gasoline, and distillates, all fell – respectively down 2.2 million barrels, 2.2 million barrels and 3.5 million barrels to 420.6 million barrels, 212.7 million barrels and 115 million barrels. Refinery utilization grew by a full percentage point to 87.7 percent.
E-mini S&P 500: Currently net long 28.1k, up 33.8k.
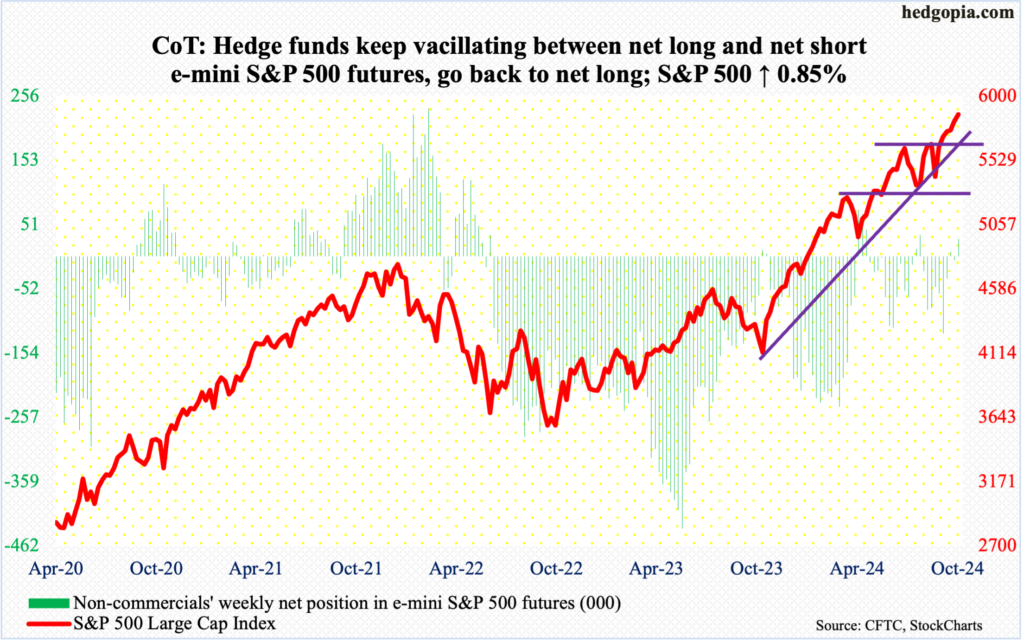
The S&P 500 rallied 0.85 percent this week to 5865, securing a sixth consecutive up week. Bulls have yet another opportunity to stage a breakout – this time at 5870s, which was hit in four of the five sessions.
In the past month, the large cap index enjoyed two important breakouts – one at 5670s on September 19 and the other at 5760s on the 9th this month.
With that said, despite this persistent strength lasting weeks, both the daily and weekly RSI (65.70 and 69.25 respectively) are yet to reach 70. The metric has not hit that overbought threshold since July when the S&P 500 went on to subsequently give back just short of 10 percent over three weeks.
The resulting confusion is reflected in non-commercials’ positioning. For the third week in a row, they have seesawed between net long and net short, with this week in the net long column.
Euro: Currently net long 17.2k, down 21.9k.
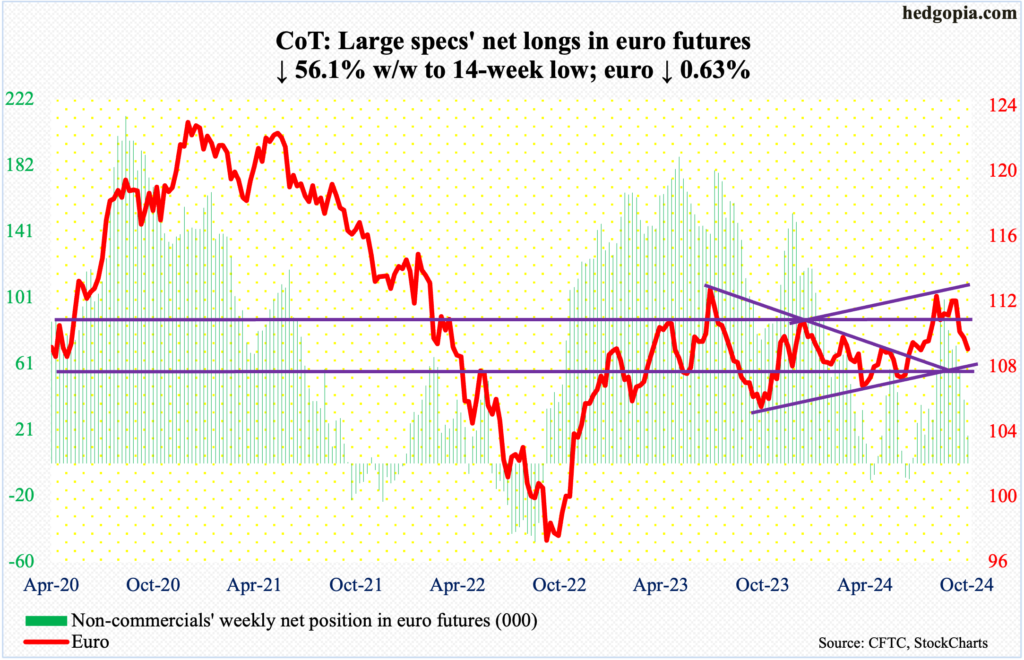
The euro has had quite a drop since late last month. On September 30, after facing rejection at $1.12 for six consecutive weeks, the currency sharply fell, proceeding to breach crucial lateral support at $1.10 by the 4th this month.
The downward pressure has continued, with this week down 0.6 percent to $1.0868. On Thursday, the European Central Bank cut interest rates for the third time this year.
The good thing from euro bulls’ perspective is that the euro fell as low as $1.0811 intraday Thursday before stabilizing. Friday’s 0.4-percent rise closed the currency just under the 200-day at $1.087. A rising trendline from October last year at $1.075 was not quite tested, but it came close.
The daily has room to rally. Bulls’ mettle will be tested at $1.09, and at $1.10 after that.
Gold: Currently net long 286.4k, up 8.3k.
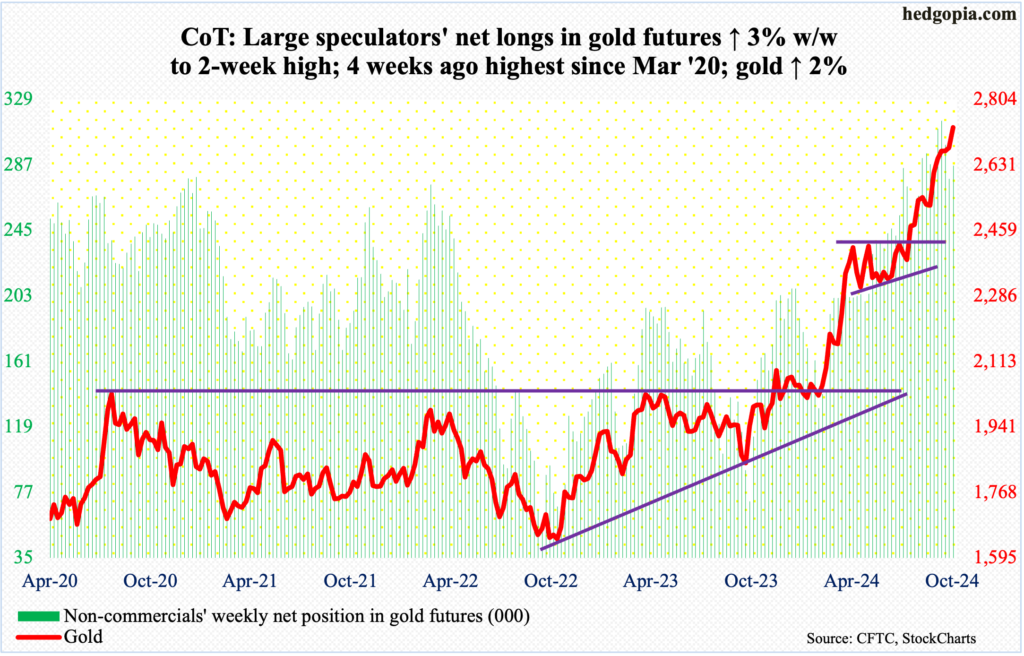
After three tentative weekly candles – shooting star, spinning top and dragonfly doji – gold yet again shone this week, up a solid two percent to $2,730/ounce, which set a fresh high.
The yellow metal has had a powerful rally since June when it tagged $2,305. In between, it enjoyed one after another breakout.
Four weeks ago, after five sessions of sideways action at $2,610s, gold broke out on September 20. This followed a breakout in the prior week at $2,540s-50s after several unsuccessful attempts since mid-August. Prior to this, after more than three months of sideways action, it broke out at $2,440s-50s in August.
This week’s breakout followed a defense of $2,610s last week.
Nasdaq (mini): Currently net long 1.4k, down 11.9k.
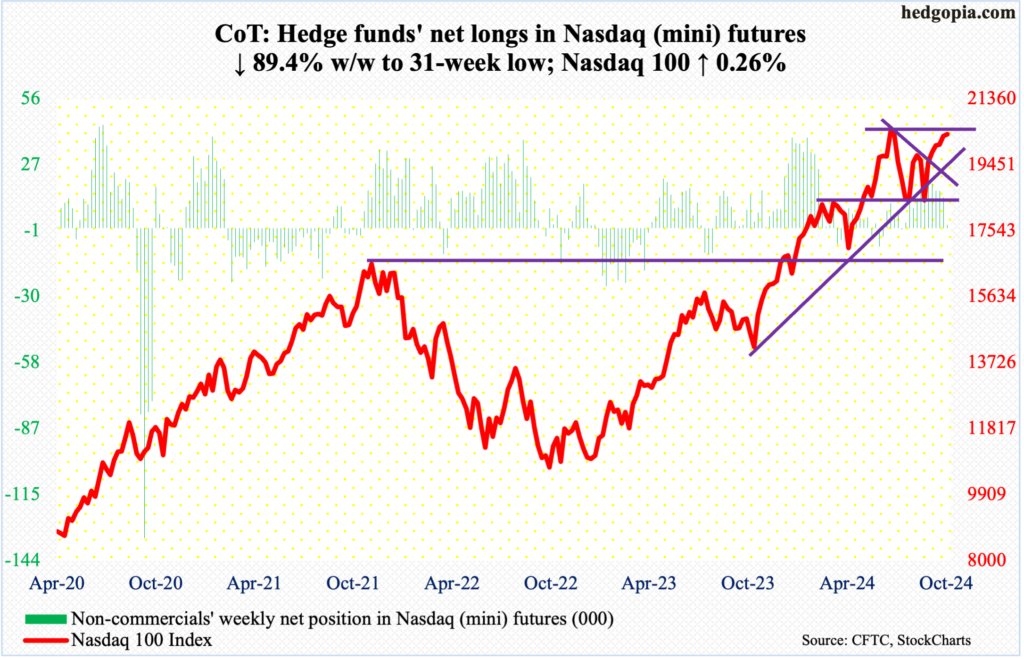
The Nasdaq 100, up a meagre 0.3 percent this week to 20324, is now up six weeks in a row, but remains under its all-time high of 20691 posted on July 10. In contrast, the S&P 500 surpassed its high from that month in September.
Tesla (TSLA) reports its September quarter next Wednesday. The week after is heavy, with several leading tech outfits reporting – Google parent Alphabet (GOOG) on the 29th, Microsoft (MSFT) and Facebook parent Meta (META) on the 30th, Apple (AAPL) and Amazon (AMZN) on the 31st. It will be interesting how tech traders will be positioning themselves next week heading into these results.
Nvidia (NVDA) does not report its October quarter until November 27.
Russell 2000 mini-index: Currently net long 26.3k, up 21.3k.
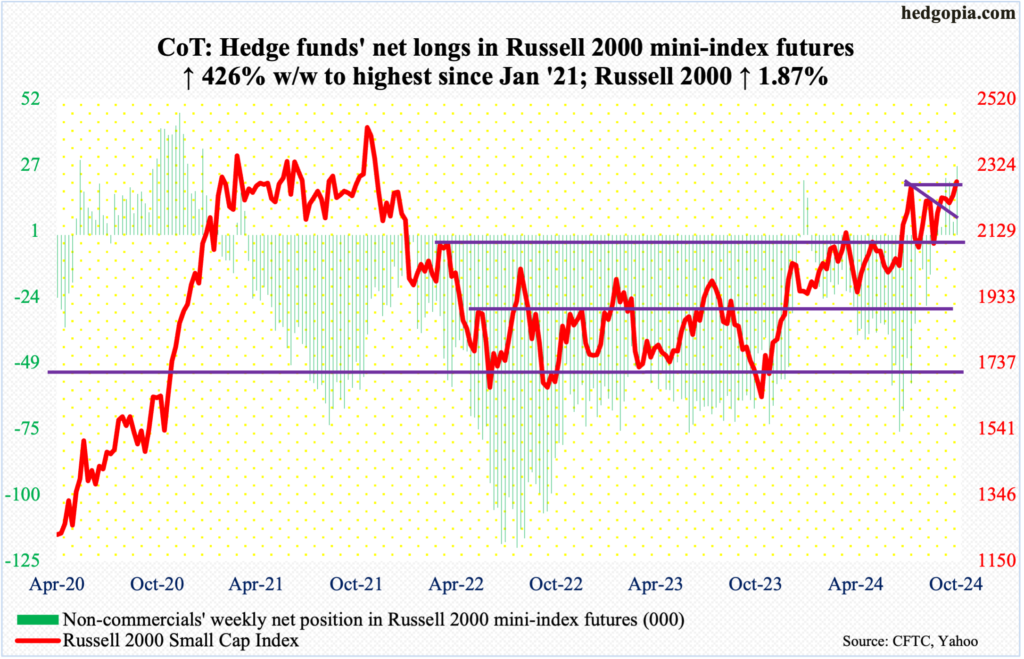
There has been improvement in small-cap action the last couple of weeks.
Last week, the Russell 2000 pushed above a descending channel going back to September 18 when it ticked 2259. Horizontal resistance at 2260s goes back to mid-July. This week, the small cap index eked out a breakout at that hurdle, with a high of 2289 on Wednesday and a close of 2276.
With these two breakouts, small-cap bulls have near-term momentum on their side. Next to watch is 2300, which was hit on July 31. A decisive takeout can change sentiment toward small-caps. The Russell 2000 remains under its all-time high of 2459 from November 2021.
US Dollar Index: Currently net short 2.1k, up 211.
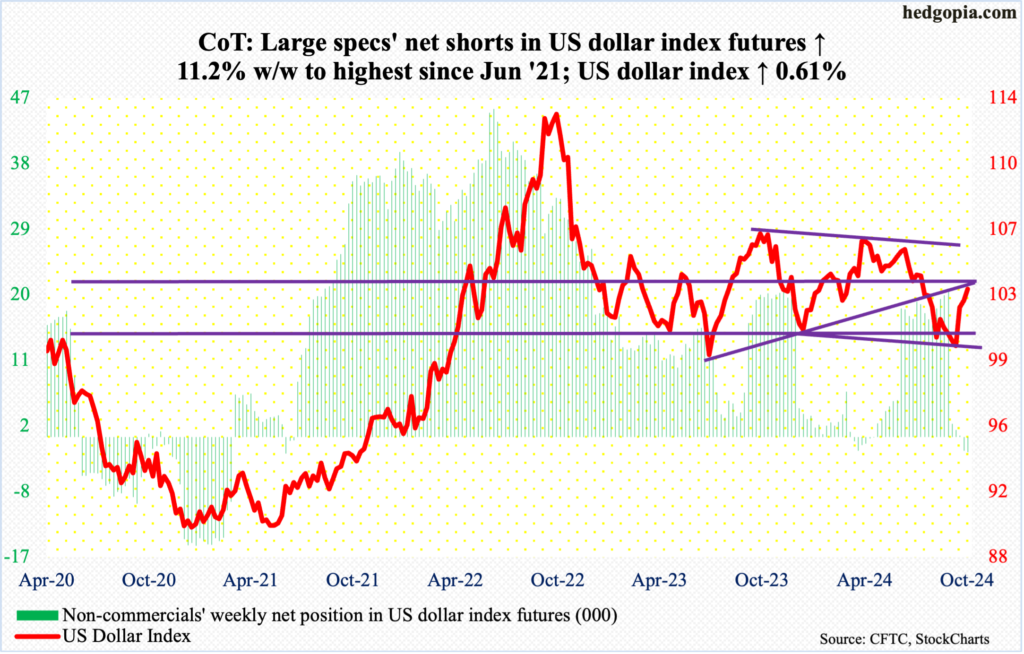
The US dollar index, up 0.6 percent this week to 103.31, has now rallied for three consecutive weeks. It began to reverse higher on September 30, after having gone sideways just under 100 for several sessions.
Earlier, the index had been under pressure since ticking 105.80 in June; this was preceded by highs of 106.38 in April and 107.05 last October, establishing a pattern of lower highs. The associated resistance lies at 105.50. Before this gets tested, there is the 200-day and the crucial 103-104, which goes back to December 2016. This week, the average at 103.62 offered resistance, with Thursday even rallying to 103.69 intraday. To boot, this is also an area (103-104) where selling is expected to pick up.
The dollar index looks tired for now.
VIX: Currently net long 322, up 3.3k.
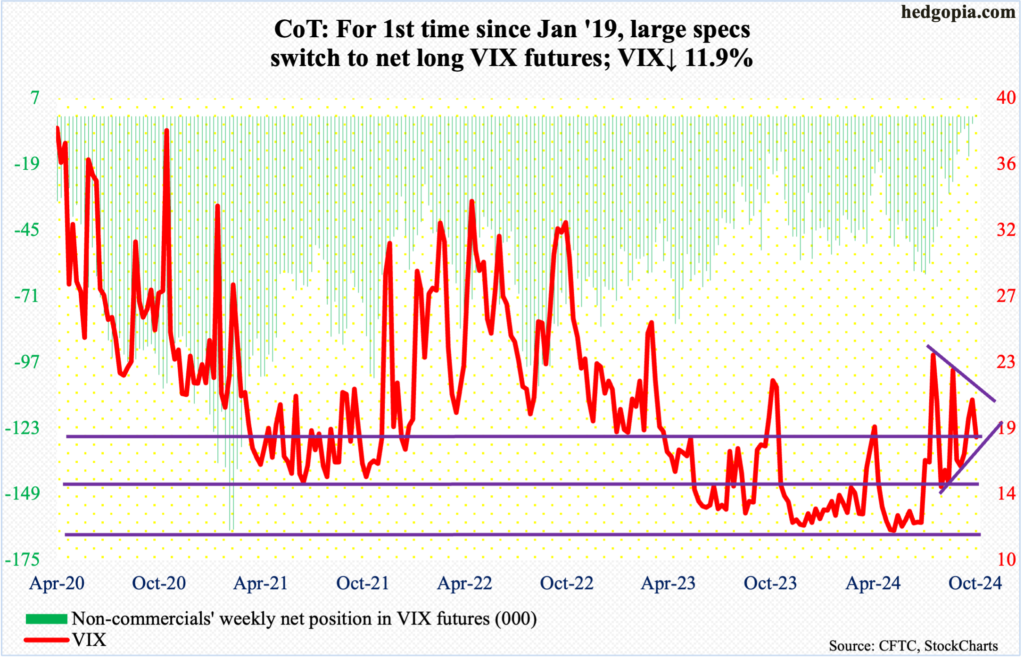
After going hand in hand with the S&P 500 for three straight weeks – all up – VIX gave back 2.43 points this week to 18.03, closing right at the 50-day. The 200-day is at 15.36, and it is entirely possible the average gets tested in the sessions ahead. The volatility index has not closed below the 200-day since mid-July.
If VIX comes under pressure in the sessions ahead, this will have occurred at a time when non-commercials just switched to net long VIX futures, which is the first time this has happened since January 2019.
If past is prelude, VIX has tended to peak once these traders go net long or get close to doing that. VIX tagged 23.14 on the 8th this month before coming under pressure.
Thanks for reading!
