Following futures positions of non-commercials are as of November 12, 2024.
10-year note: Currently net short 815.8k, down 2.5k.
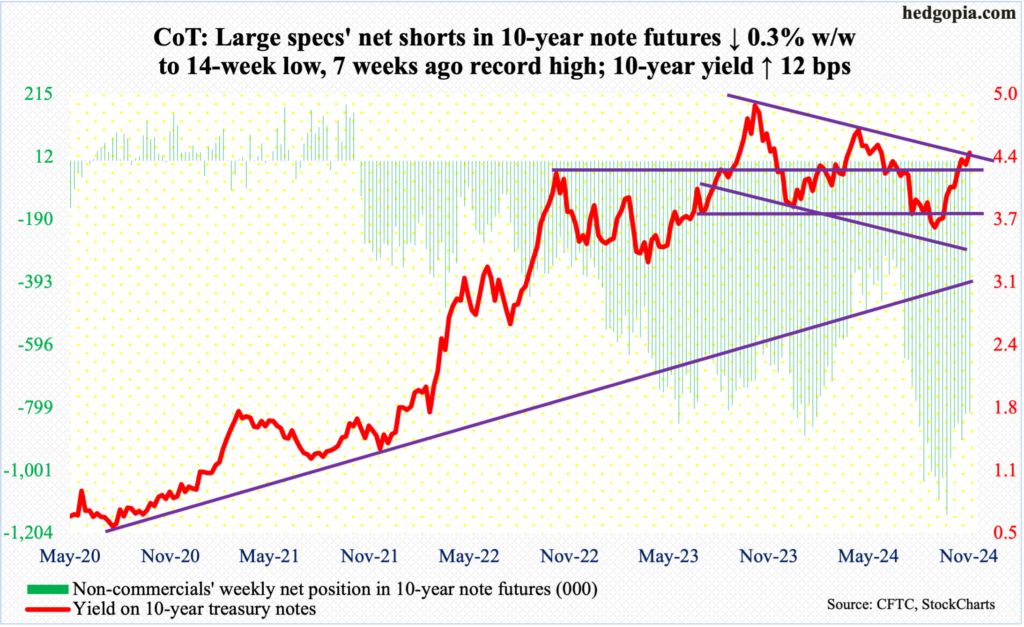
On the back of stronger-than-expected data – from consumer and wholesale inflation to retail sales as well as Chair Jerome Powell’s hawkish remarks – the 10-year treasury yield added 12 basis points to 4.43 percent this week. At Friday’s intraday high of 4.51 percent, in fact, yields were up 20 basis points, but bond bears (on price) were unable to hang on to those.
The 10-year has come a long way since September 17 when these notes yielded 3.6 percent. A little fatigue is only natural. Besides, rates are hitting against stiff resistance – that of a falling trendline from October last year when they peaked at five percent. Last week, a weekly shooting star formed right on that resistance. This week, the 10-year closed right on that potential hurdle. Until a breakout occurs, odds favor the bulls (on price) at this point.
President-elect Donald Trump’s win last week has the potential to turn the rates outlook on its head, with uncertainty surrounding the budget deficit, tariffs and a whole host of other things. It is anyone’s guess where the 10-year might land in the quarters to come, but right here and now it is probably headed lower.
Immediately ahead, there is support at 4.3s.
Of note, non-commercials have been gradually reducing their net shorts in 10-year note futures – from 1,143,889 contracts in the week to October 1 to 815,801 this week.
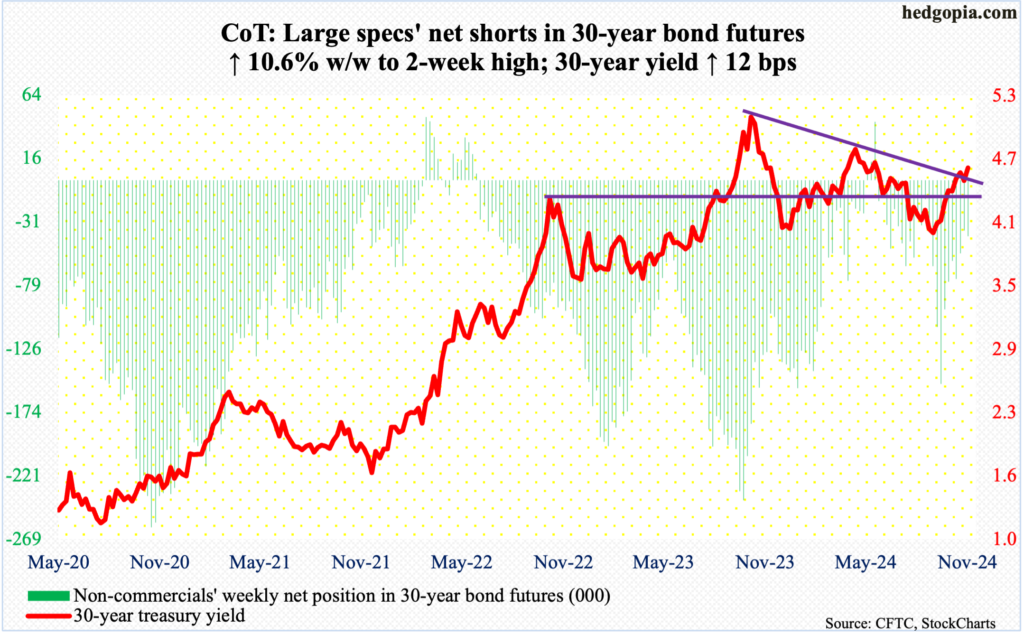
30-year bond: Currently net short 41.8k, up 4k.
Major US economic releases for next week are as follows.
The Homebuilder Housing Market Index (November) will be published Monday. Homebuilder optimism increased a couple of points month-over-month in October to 43, matching June’s reading. In the past year, the index vacillated between 34 (November) and 51 (March-April).
Housing starts (October) are due out Tuesday. In September, starts declined 0.7 percent m/m to a seasonally adjusted annual rate of 1.35 million units. July’s 1.26 million was the lowest since June 2020.
Thursday brings existing home sales (October). September sales fell one percent m/m to 3.84 million (SAAR).
University of Michigan’s Consumer Sentiment Index (November, final) is scheduled for Friday. Preliminarily, sentiment firmed up 2.5 points m/m in November to 73 – a 7-month high. March’s 79.4 was the highest since July 2021.
WTI crude oil: Currently net long 179.3k, down 15k.
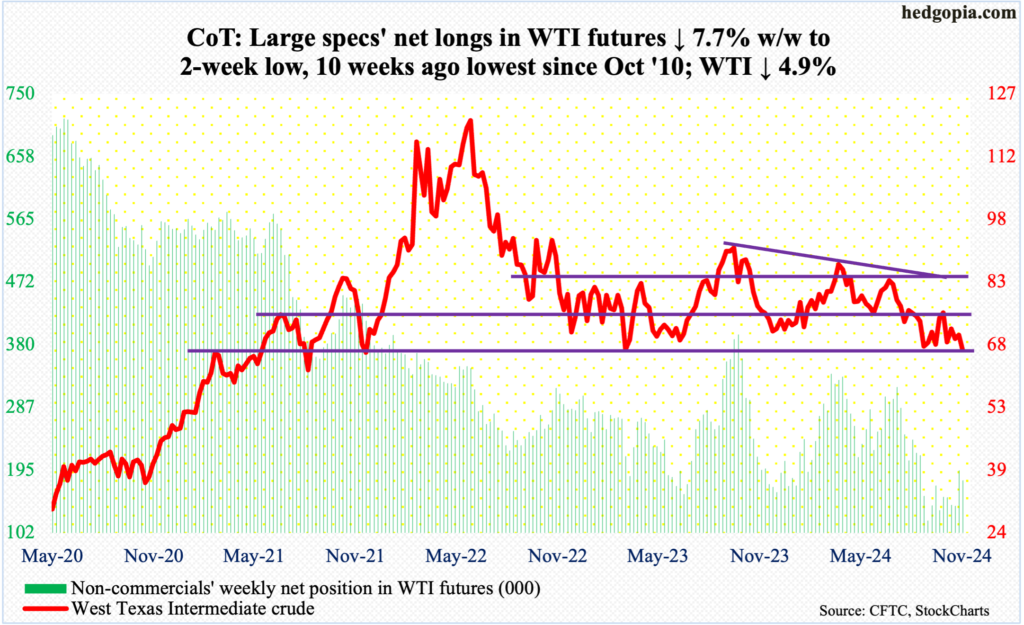
West Texas Intermediate crude is teetering on support. The past couple of months, it has found buyers at $66-$67. On September 10, it fell as low as $65.27. Since September last year when the crude ticked $95.03 before heading lower, it has made lower highs, with the most recent being $78.46 on October 10.
This week, WTI gave back 4.9 percent to $66.92/barrel. Support at $66-$67 makes up the lower horizontal trendline of a descending triangle, hence crucial. It is a must-save for oil bulls. Should bids show up in the sessions ahead, what then happens at $71-$72 is even more important. For months, WTI played ping pong between $71-$72 and $81-$82. The support was lost early September. Since then, for the most part, the support-turned-resistance has held.
In the meantime, after remaining unchanged for four consecutive weeks at 13.5 million barrels per day – a record – US crude production in the week to November 8 dropped 100,000 b/d to 13.4 mb/d. Crude imports increased 269,000 b/d to 6.5 mb/d. As did crude inventory, which grew 2.1 million barrels to 429.7 million barrels. Stocks of gasoline and distillates, however, fell – respectively down 4.4 million barrels and 1.4 million barrels to 206.9 million barrels and 114.4 million barrels. Refinery utilization rose nine-tenths of a percentage point to 91.4 percent.
E-mini S&P 500: Currently net long 25k, down 88.4k.
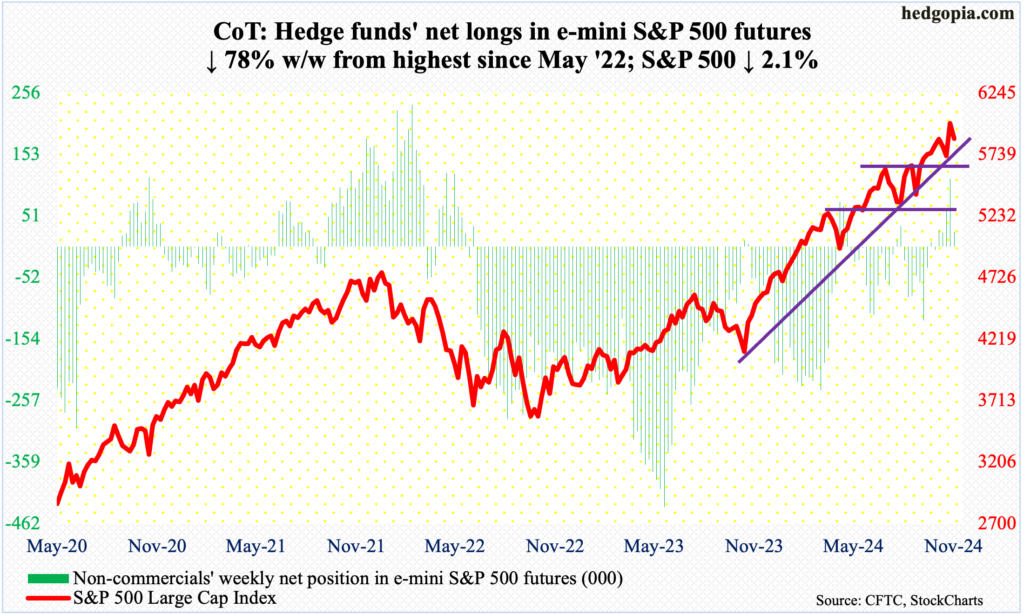
Last week’s 4.7-percent jump post-election extended this week, but just barely.
On Monday, the S&P 500 posted a new intraday high of 6017 but only to then come under decent pressure. By the end of the week, the large cap index gave back 2.1 percent to 5871 – right on one-month horizontal support at 5870s. This is in fact a retest of a gap-up breakout that occurred on November 6, which is the day after the election – successfully thus far, but likely to give way in the sessions ahead. The gap gets filled at 5780s, which equity bulls are likely to fight tooth and nail to save. Just below lies the 50-day at 5772. The index has remained above the average since September 11.
Euro: Currently net short 7.4k, down 14.2k.
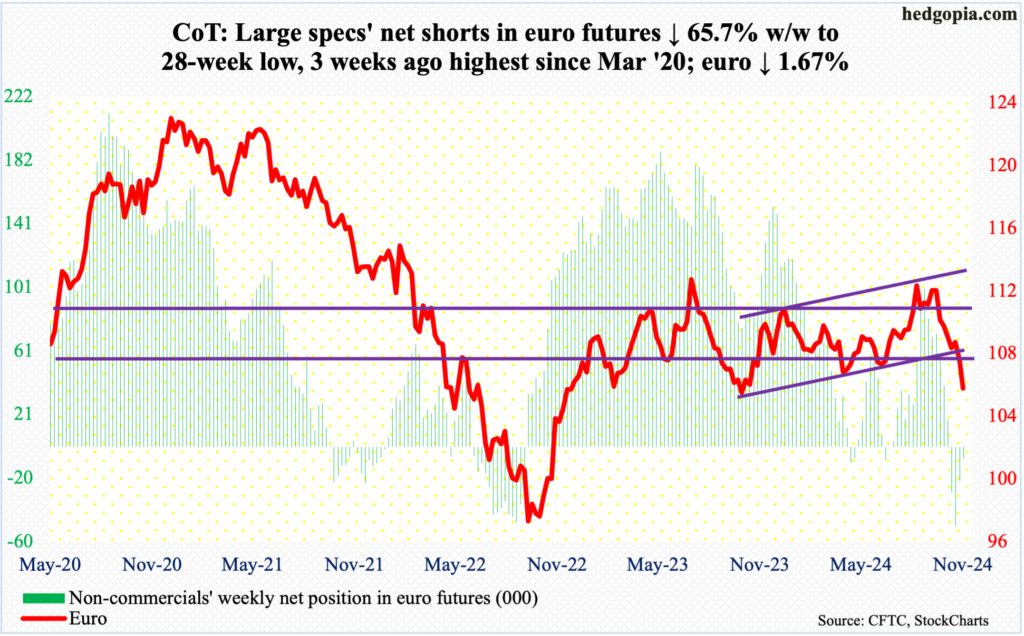
The euro decisively breached a rising channel from October last year. It bottomed at $1.0048 back then, having earlier peaked at $1.1276 in July.
This week, the currency yielded 1.7 percent to $1.0539. This was the sixth down week in seven. On September 30, after facing rejection at $1.12 for six consecutive weeks, the euro sharply fell, proceeding to breach crucial lateral support at $1.10 by the 4th last month.
This week brought more misery to the bulls, who now need to act. There is horizontal support at $1.05, which goes back nearly a decade. They cannot afford a breach of this level.
Gold: Currently net long 236.5k, down 18.9k.
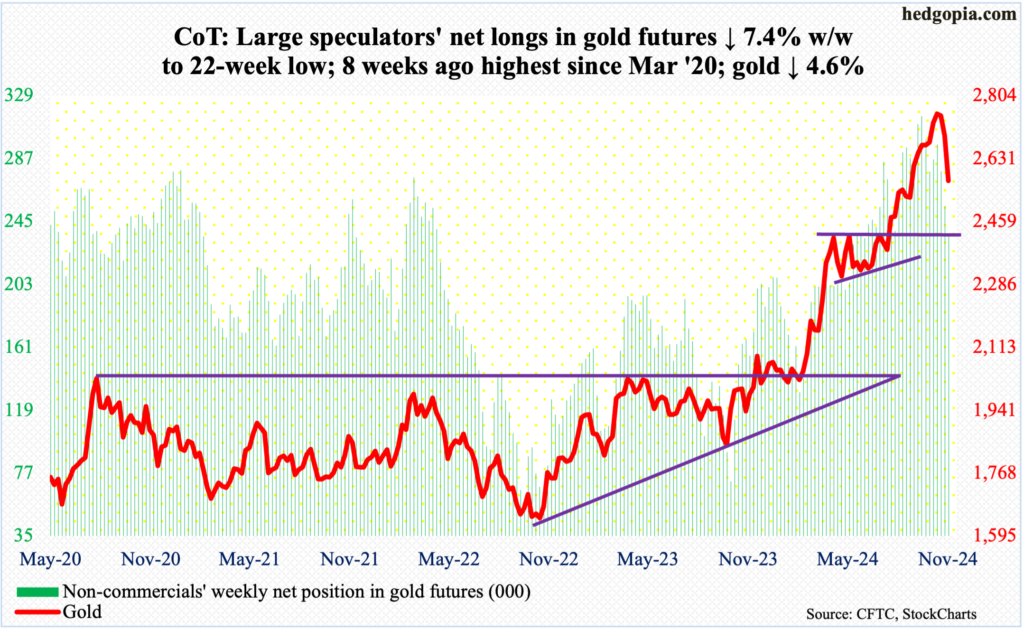
The week began by gold slicing through its 50-day on Monday. This was then followed by four more sessions of selling, ending the week down 4.6 percent to $2,570/ounce.
A couple of weeks ago, after rallying in six of seven weeks, a gravestone doji showed up on the weekly. Since then, the metal has dropped back-to-back. On October 30, gold reached a new high of $2,802. On the way to that peak, there were several breakouts – $2,610s eight weeks ago, $2,540s-50s nine weeks ago and $2,440s-50s in August.
Gold bugs can take solace in the fact that $2,540s-50s remains intact, with Thursday’s intraday drop to $2,542 attracting buying interest. The daily has gotten oversold, so a rally is possible. Else, bears will be eyeing $2,440s-50s, with the 200-day at $2,409.
Nasdaq (mini): Currently net long 16.4k, up 288.
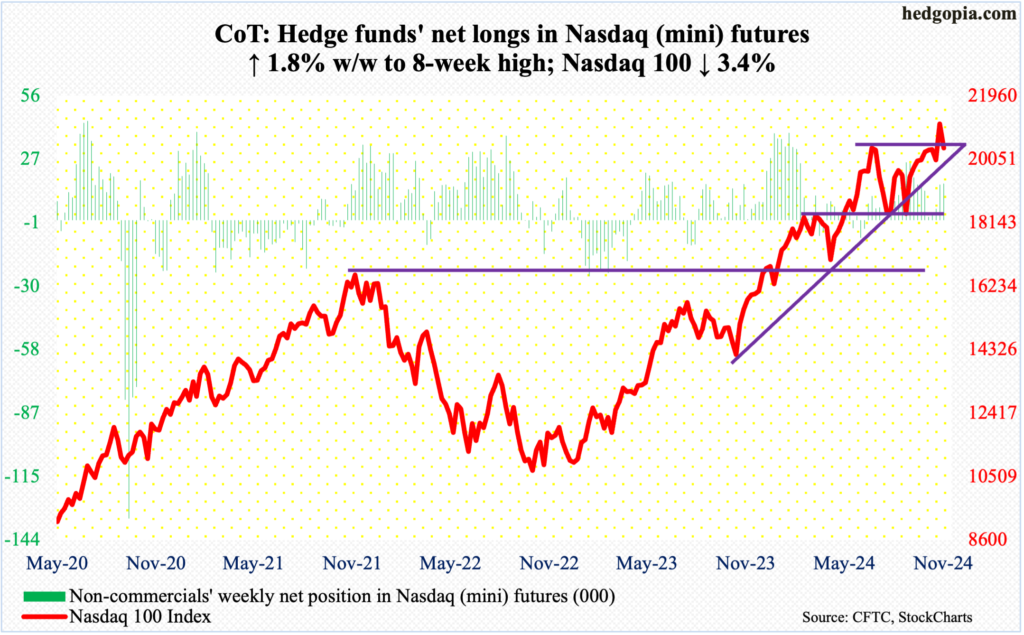
November is halfway through and if the index ends the month around here, a monthly shooting star would show up, which would have come after October’s spinning top.
This week, the tech-heavy index fell in all five sessions, including Monday when a new intraday high of 21182 was posted. Three sessions before that – or on the 6th – it gapped up to take out the July high of 20691. This was followed by another gap-up on the 7th, which mixed with Friday’s gap-down, makes up a bearish island reversal. The index gave back 3.4 percent this week to 20394.
The 50-day is at 20103, and how the index acts around here in the sessions ahead – whether tech bulls show interest in defending the average – will be telling.
Russell 2000 mini-index: Currently net long 8.4k, down 398.
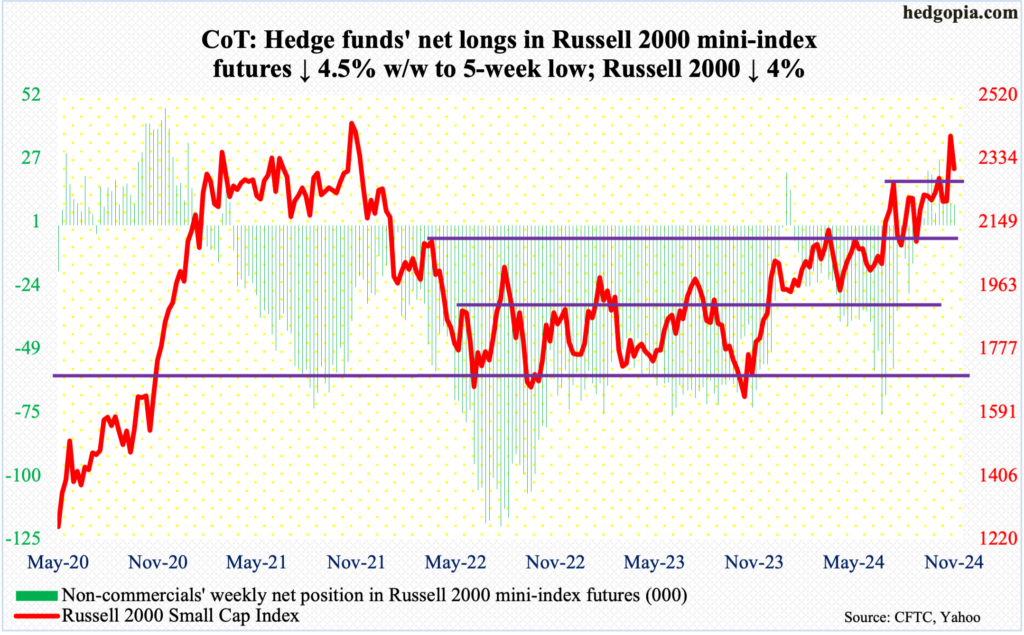
At Monday’s intraday high of 2442, the Russell 2000 was merely 17 points from the all-time high of 2459 posted in November 2021. It then dropped the next four sessions to end the week lower four percent to 2304. This preceded last week’s post-election 8.6-percent surge.
Inability to rally to a new high after coming so close is not encouraging news for small-cap bulls. All other major equity indices have left their highs from 2021 and 2022 behind, but not the Russell 2000.
For now, 2260s bear watching, as this horizontal resistance going back to mid-July was taken out on the 6th. It is a breakout retest of sorts.
US Dollar Index: Currently net short 2.3k, up 2.4k.
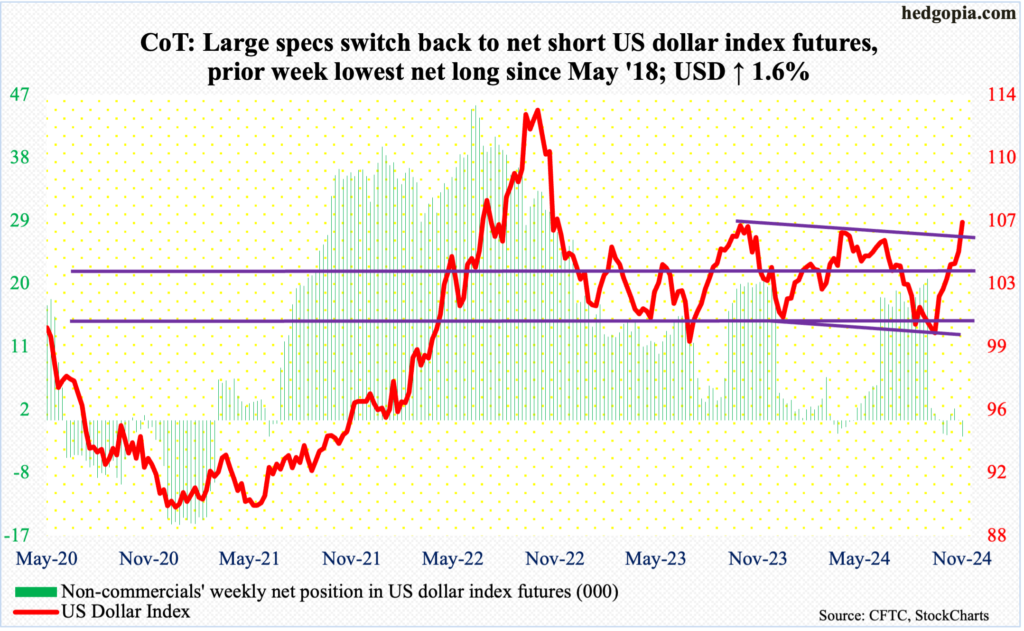
The US dollar index scored a major win this week and came so close to scoring another. Up 1.6 percent this week to 106.61, this was the seventh up week in a row. The index began to reverse higher on September 30, after having gone sideways just under 100 for several sessions.
Earlier, the index had been under pressure since ticking 105.80 in June; this was preceded by highs of 106.38 in April and 107.05 last October, establishing a pattern of lower highs. This trendline resistance was taken out this week. As well, at Thursday’s intraday high of 106.99, it was within striking distance of 107.05 which was hit in October last year. A breakout here will be massive for dollar bulls, although they may find it difficult to pull this off right away.
The daily remains way overbought. Odds favor some weakness here. Nearest support lies at 105.70s.
VIX: Currently net short 4.4k, down 12.2k.
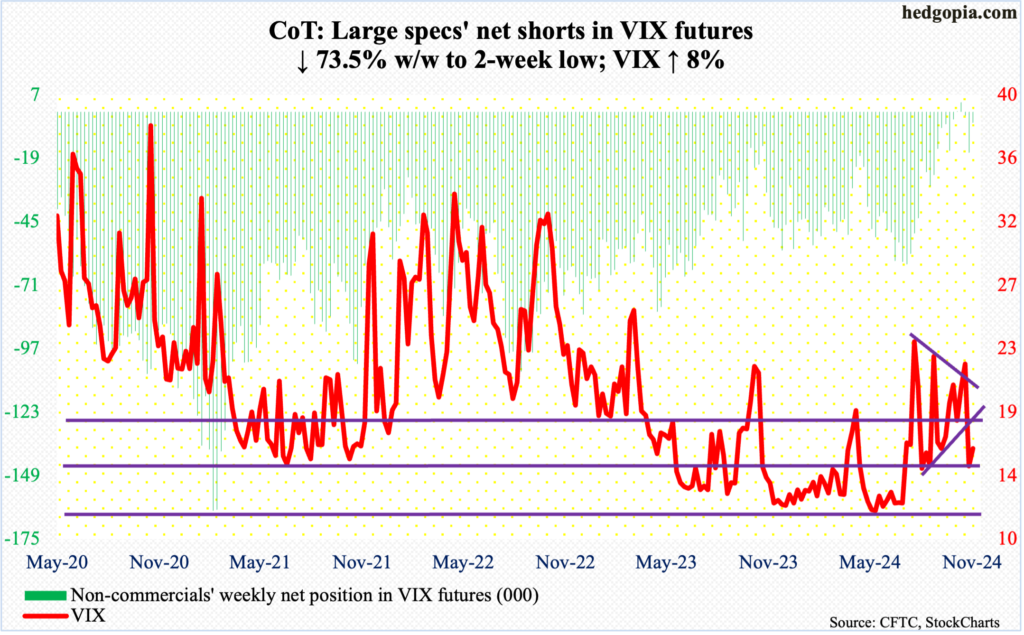
After tumbling 6.94 points last week and at risk of losing 15 on the way to 12-13, volatility bulls put their foot down this week. VIX did tag 13.59 intraday Thursday before closing the session at 14.31, followed by a Friday/weekly close at 16.14.
Ahead, the gap-down on the 6th gets filled just north of 20. After that comes the all-important 23-plus, which has resisted rally attempts since early September, including late October and early this month.
Thanks for reading!

