In a seasonally favorable period, new highs keep coming for the major US equity indices. This has pushed several sentiment indicators into gross overbought territory.

The S&P 500 last Friday enjoyed its 56th all-time high for the year. With three weeks of trading left, 2024 is up 27.7 percent. This comes after a 24.2-percent jump last year. From the lows of October last year and the year before, the large cap index is up 48.4 percent and 74.4 percent, in that order. Unreal!
Right here and now, equity bulls are riding the seasonal tailwind. Before this, the November 5th election was the catalyst. The S&P 500 added 300 points after it became apparent that Donald Trump would be the president-elect.
Last week – up one percent – was the third consecutive positive week. Rallying as high as 6100 intraday, Friday closed at 6090 (Chart 1). Technicals remain overbought and have been that way for a while now. In the event of downward pressure in the sessions ahead, there is support at 6010s.

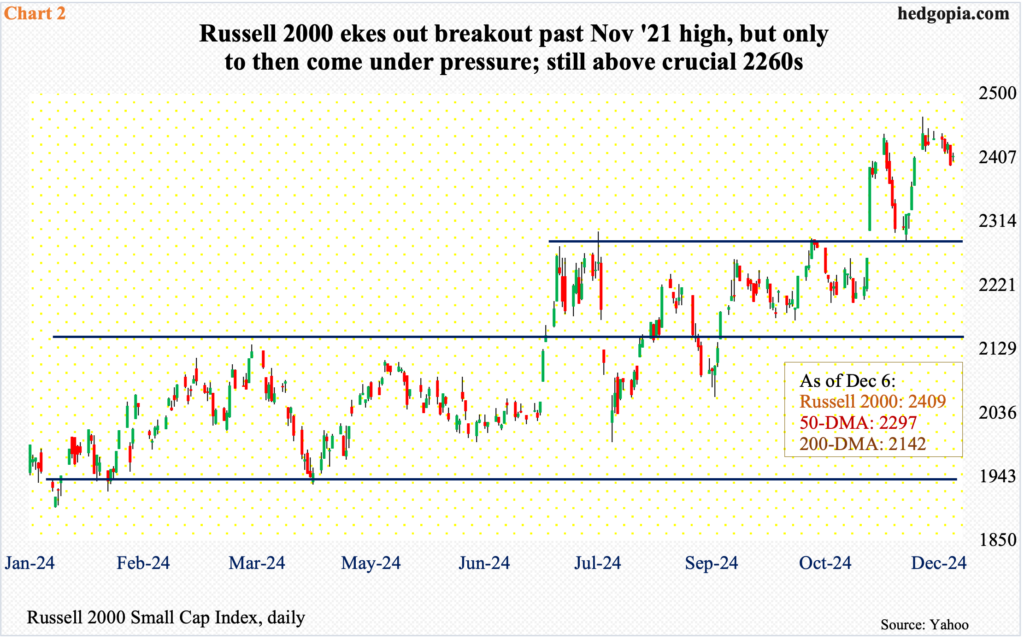
The Russell 2000, which lagged its large-cap peers for months when it came to posting new highs, has now achieved that feat. On November 25, the small cap index reached 2466 – just ahead of the prior high of 2459 from November 2021.
As soon as the index reached that milestone, sellers showed up, as minor profit-taking has unfolded. The Russell 2000 ticked 1993 as recently as August 5.
Nevertheless, so long as the index (2409) remains above 2260s, which goes back to mid-July (Chart 2), the ball remains with the bulls.

The Nasdaq 100, too, peaked in November 2021, but it surpassed that high last December. It subsequently suffered a 15.7-percent drawdown over four weeks in July and August, then taking four months to take out the July high.
Last Tuesday, the tech-heavy index gapped up and broke free of 21100s where it stalled for a couple of sessions, with the week then closing at 21622 (Chart 3). With a fresh breakout, momentum remains with the bulls so long as the index remains above 20500s.

With these indices recording one after another high, sentiment not surprisingly has firmed up quite a bit.
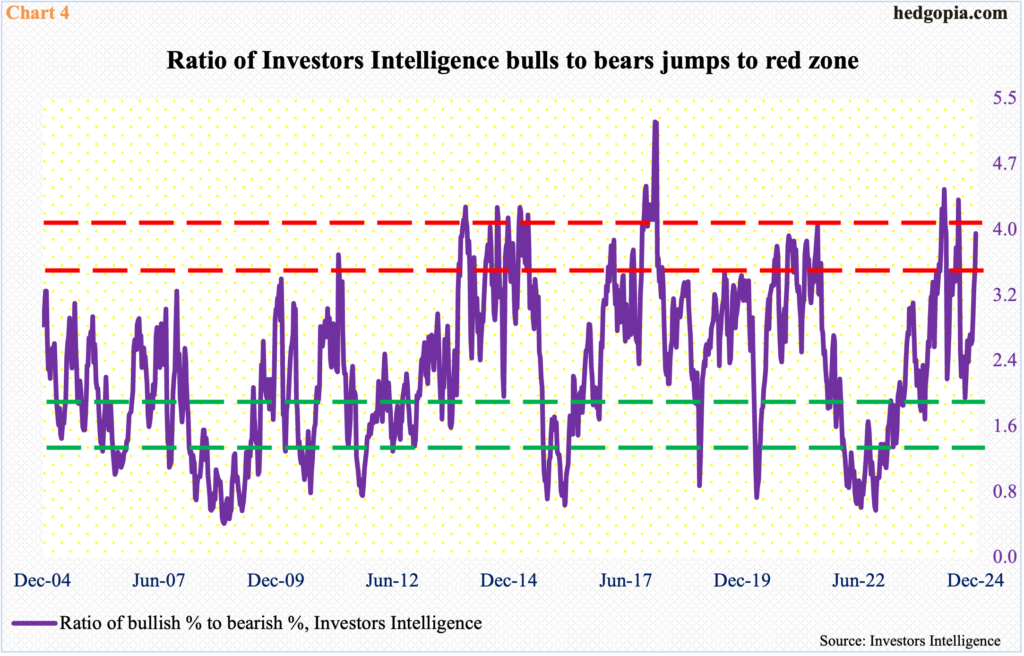
In the week to last Tuesday, Investors Intelligence bulls added 1.6 percentage points week-over-week to 62.9 percent – a 19-week high – even as the bearish count dropped by as much to 16.1 percent, which set an 18-month low. Bulls are now 60 percent or higher for four weeks in a row. In June and July this year, the streak ended after seven weeks, even as the S&P 500 lost just under 10 percent from high to low over three weeks.
In a seasonally strong period, it is entirely possible the bullish momentum persists, pushing further into overbought – even frothy – territory. Last week, the ratio of bulls to bears came in at 3.91, versus the 4.31 reading in the week to July 23. Regardless, the ratio is well into the red zone (Chart 4).

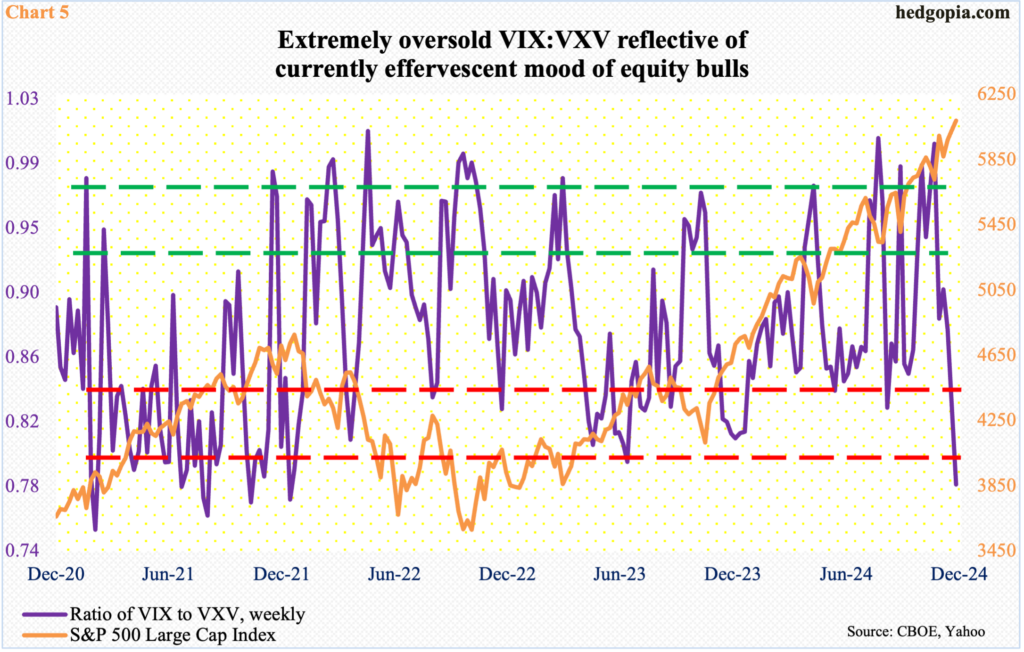
A similar conclusion can be drawn looking into how volatility is behaving. The ratio of VIX to VXV last week closed at .782 – a three-year low.
VIX measures market’s expectation of 30-day volatility on the S&P 500. VXV does the same, except it goes out to three months. When the investing climate is risk-on, as has been the case of late, demand for VIX-derived securities is lower than, let us say, VXV. The opposite is true when investor sentiment wanes.
If past is prelude, the ratio has genuinely tended to bottom in the high-0.70s to low-80s. Once it bottoms and heads higher, VIX begins to outperform VXV, putting the S&P 500 under pressure.
Last week, VIX closed at 12.77, which was the lowest in nearly five months, and is approaching crucial support at 12.

Elsewhere in the options market, bullish sentiment is pervasive.
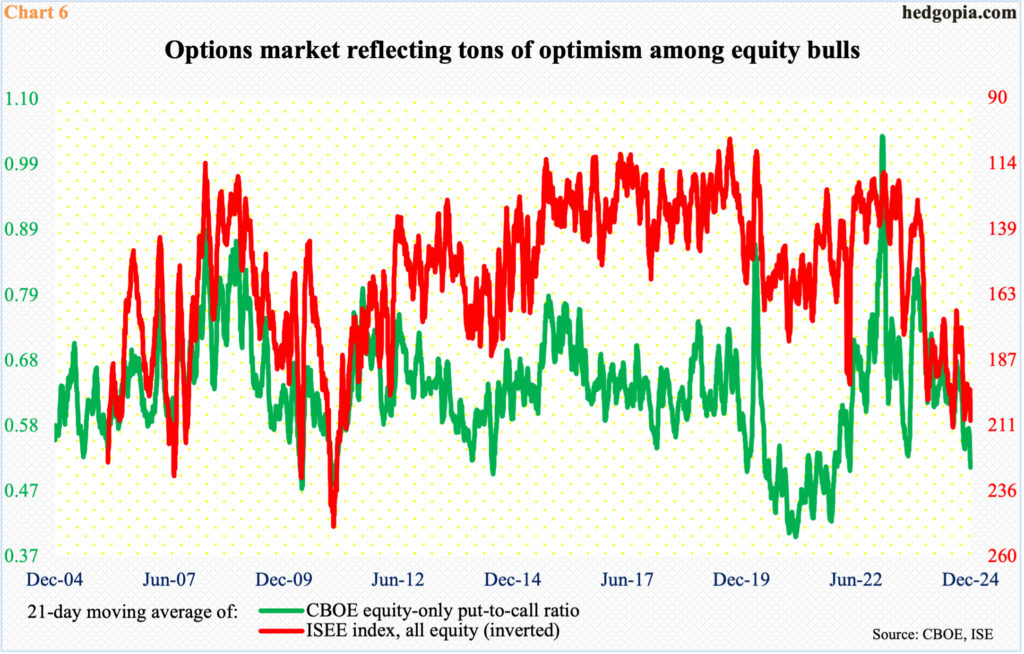
The 21-day moving average of the CBOE equity-only put-to-call ratio last Friday closed at .515, with Thursday’s .512 the lowest going back to April 2022. The ISEE index in the meantime printed 209.6 – not that far away from July’s high of 212.1, which was the highest since April 2011.
In Chart 6, the ISEE index is inverted as it is a call-to-put ratio. Unlike the CBOE put-to-call ratio, the ISEE index excludes trades from market makers and broker/dealers. As well, it only uses opening long trades. So from the perspective of sentiment reading, the latter is a clean number. Market makers, for instance, need to hedge exposure all the time. Retail traders on the other hand bet on direction.
Further, an increase in put volume, for instance, may suggest retail traders are expecting a move lower, but they might very well be selling what they bought earlier. Or, they might be deploying short puts, or bull put spreads. Often, information can be gleaned from whether a trade is done at the bid or the ask, or from the way open interest has changed, but once again one large order can distort the picture.
With that said, when the two lines in Chart 6 tilt one way rather heavily, it tends to pay off going the other way. For contrarians, elevated investor sentiment and volatility dynamics are pointing the same way.
Thanks for reading!

