
Following futures positions of non-commercials are as of March 10, 2026.
10-year note: Currently net short 534.9k, down 119.6k.
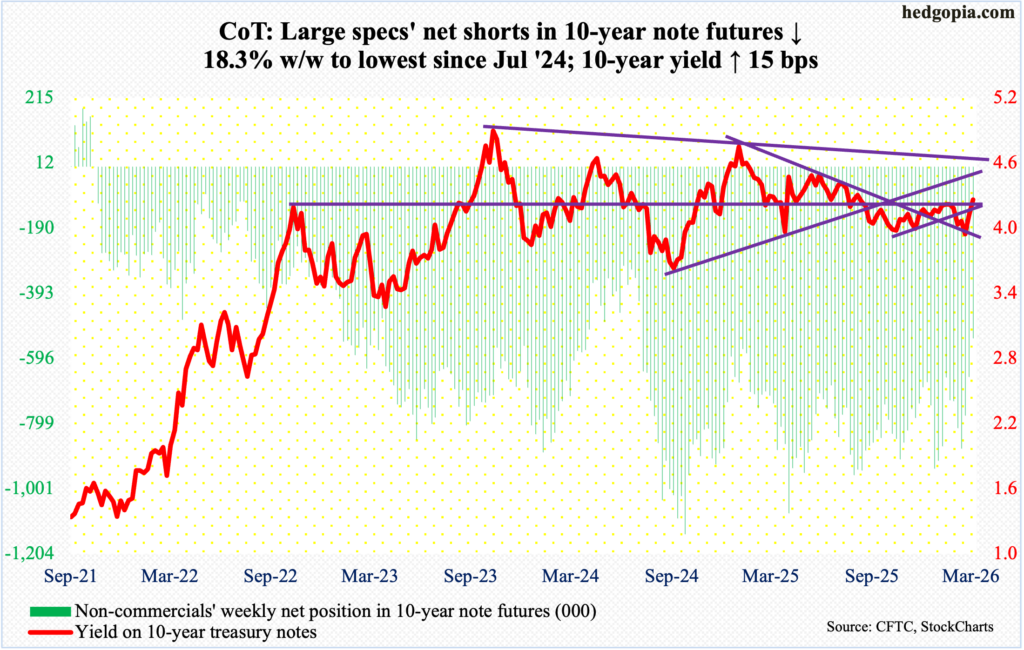
In the 12 months to January, headline and core CPI rose 2.4 percent and 2.5 percent respectively; headline and core PCE for the same timeframe were up 2.8 percent and 3.1 percent, in that order. PCE, out Friday, comes out later in the month than CPI, and is the Federal Reserve’s favorite, particularly the core reading, which set a 22-month high in January.
Energy has a higher weight in PCE, and this can complicate things further if the current spike in oil prices persists. With an FOMC meeting on schedule next week, the Fed, with a dual mandate of price stability and maximum employment, is caught between a rock and a hard place. The job market has decidedly shifted lower, but consumer inflation is proving to be sticky, although it is much lower than the four-decade highs of 2022. The Fed targets two percent on core PCE.
No one expects the Fed to make a move in next week’s meeting. The fed funds rate will be left unchanged at a range of 350 basis points to 375 basis points. As things stand, futures traders are not pricing in a 25-basis-point cut until December; until just a few weeks ago, they were expecting two cuts this year. This softening in market expectations is a blessing in disguise for the Fed, as it would prefer to sit on its hands as long as possible, given the changed dynamics in geopolitics and their impact on commodities and the economy.
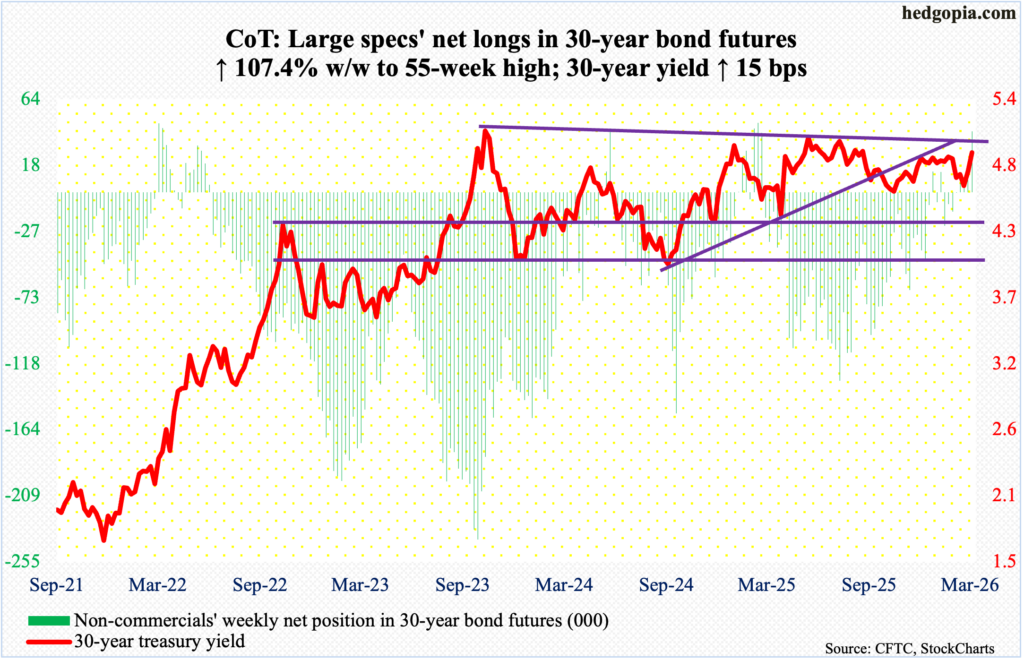
30-year bond: Currently net long 42k, up 21.8k.
Major US economic releases for next week are as follows.
Industrial production/capacity utilization (February) is on schedule for Monday. Capacity utilization in January rose 0.6 percent month-over-month to 76.2 percent – a six-month high.
The NAHB housing market index (March) is due out Tuesday. Homebuilder optimism in February fell a point m/m to 36, which was a five-month low.
Wednesday brings the producer price index (February) and factory orders (January, revised).
In the 12 months to January, headline and core wholesale prices rose 2.9 percent and 3.4 percent respectively.
Orders for non-defense capital goods ex-aircraft – proxy for business capex plans – edged lower 0.03 percent m/m in January to a seasonally adjusted annual rate of $79.27 billion. December’s $79.29 billion set a new high.
New home sales (January) are scheduled for Thursday. December sales of 745,000 units (SAAR) were down 1.7 percent from November’s 45-month high 758,000.
The employment cost index (4Q25, revised) will be released Friday. Preliminarily, private-industry compensation in the December quarter increased 3.4 percent from a year ago. This was the slowest pace of year-over-year growth in 18 quarters.
WTI crude oil: Currently net long 201.9k, up 9.8k.
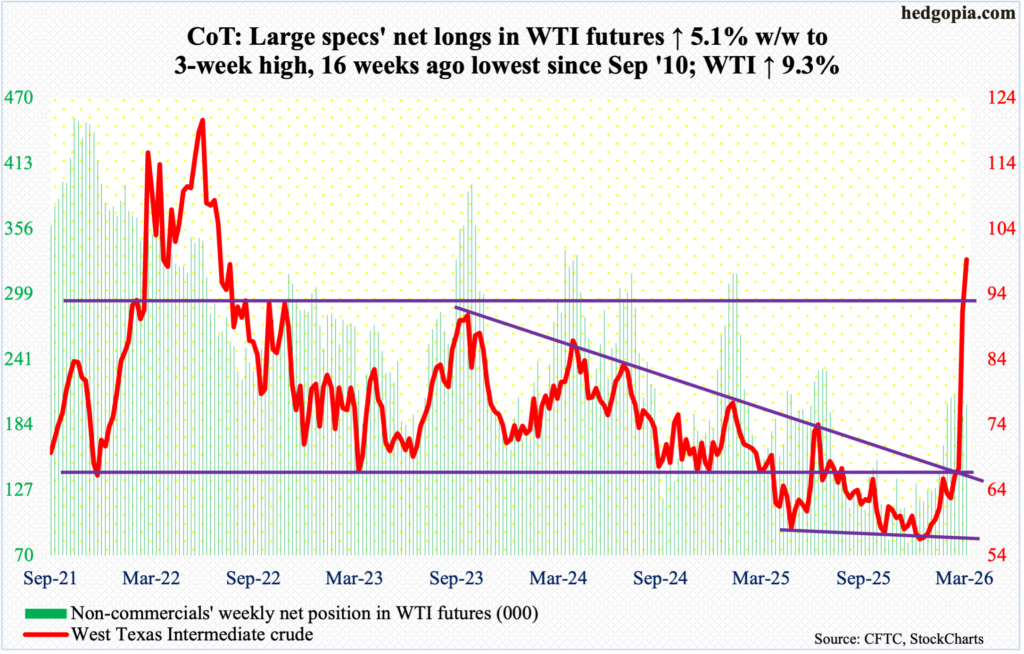
West Texas Intermediate crude began the week where it left off last week. Reacting to the Middle East conflict, it surged 36.2 percent to $90.90 last week. This week, the positive momentum continued, with Monday rising as high as $119.48 but closing at $94.77 with a session low of $81.19. Monday’s high, which is the highest since the March 2022 high of $126.42, was never visited in the remaining sessions. When it was all said and done, the crude finished the week up 9.3 percent to $99.31/barrel, forming a very wide spinning top on the weekly.
Oil bulls’ inability to hang on to Monday’s high could prove to be important in the days and weeks to come. WTI has moved a lot in a short period of time, pricing in a lot of bad news – both current and potential. Digestion of these gains is possible in the days ahead. In the event the crude comes under pressure, bulls will have an opportunity to step up and defend $92 and change – an important price point going back many years.
In the meantime, as per the EIA, US crude production in the week to March 6 decreased 18,000 barrels per day week-over-week to 13.678 million b/d; output registered a record 13.862 mb/d in the week to November 7 last year. Crude imports increased 98,000 b/d to 6.4 mb/d. As did crude inventory, which grew 3.8 million barrels to 443.1 million barrels. Stocks of gasoline and distillates went the other way, down 3.7 million barrels and 1.3 million barrels to 249.5 million barrels and 119.4 million barrels respectively. Refinery utilization rose 1.6 percentage points to 90.8 percent.
E-mini S&P 500: Currently net short 134.5k, down 33.7k.
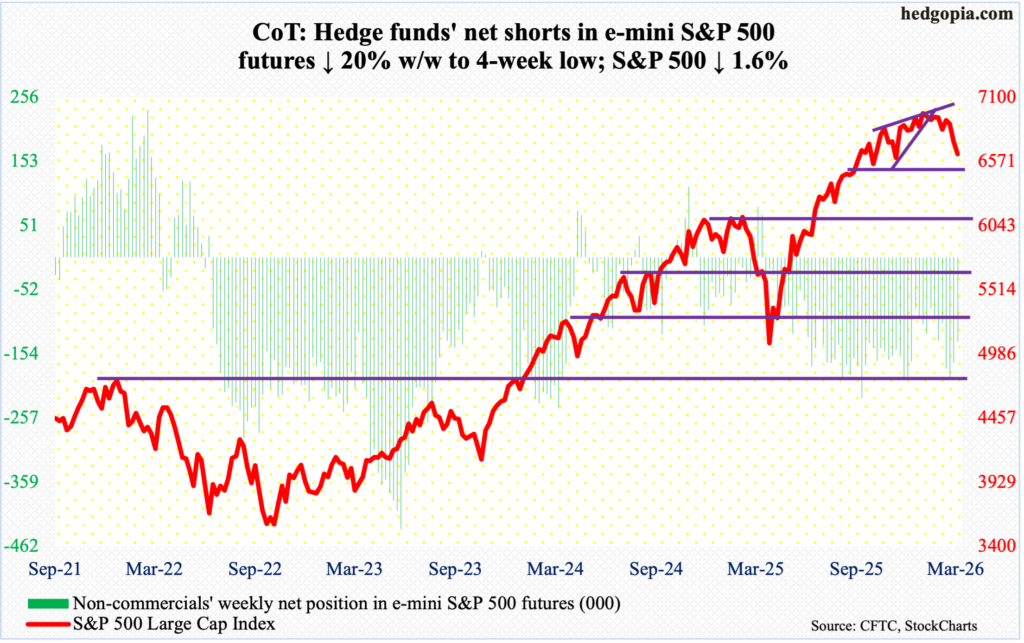
In a volatile week, with a high of 6845 and a low of 6624, the S&P 500 dropped 1.6 percent to 6632, closing right at lateral support at 6630s. As a result, a shooting star showed up on the weekly, continuing a trend of lower highs since the large cap index posted a new all-time high 7002 on 28 January.
Just below lies the 200-day at 6604. The average has not been tested since last May. This support is unlikely to give way on the very first test. Besides, in the event the 200-day is breached, there is horizontal support underneath at 6550s.
Should a rally ensue in the sessions to come, this will be one to sell at resistance. The 50-day is at 6884, and there is straight-line resistance at 6770s, which goes back five months. Mid- to long-term, the monthly has just begun to unwind the overbought condition it is in. In April last year, the S&P 500 bottomed at 4835.
Euro: Currently net long 105.1k, down 31.4k.
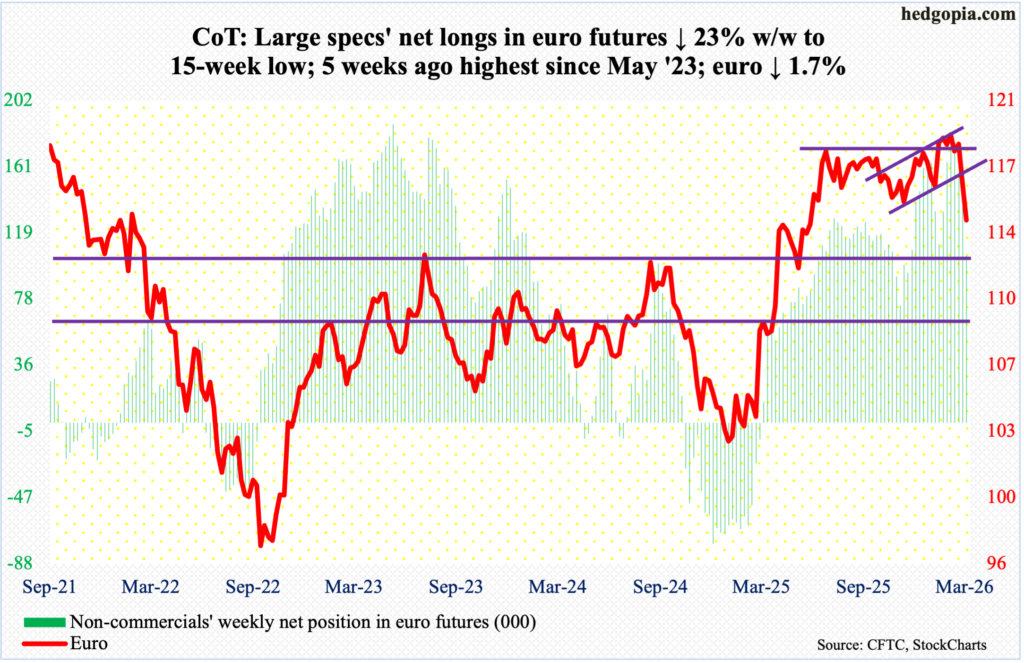
The euro suffered a back-to-back negative week – down 1.8 percent last week and down 1.6 percent this week to $1.142. Tuesday’s attempt to rally toward the 200-day ($1.168) was outright rejected with a session high $1.167. By Friday, the currency sliced through horizontal support at $1.15s.
Earlier, on 27 January, the euro tagged a four-and-a-half-year high $1.208 and reversed lower. In January last year, it bottomed at $1.018.
Euro bears now are probably beginning to eye $1.11-$1.12, although a rally near term is always possible, as the daily is extended to the downside.
Gold: Currently net long 163.1k, up 3k.
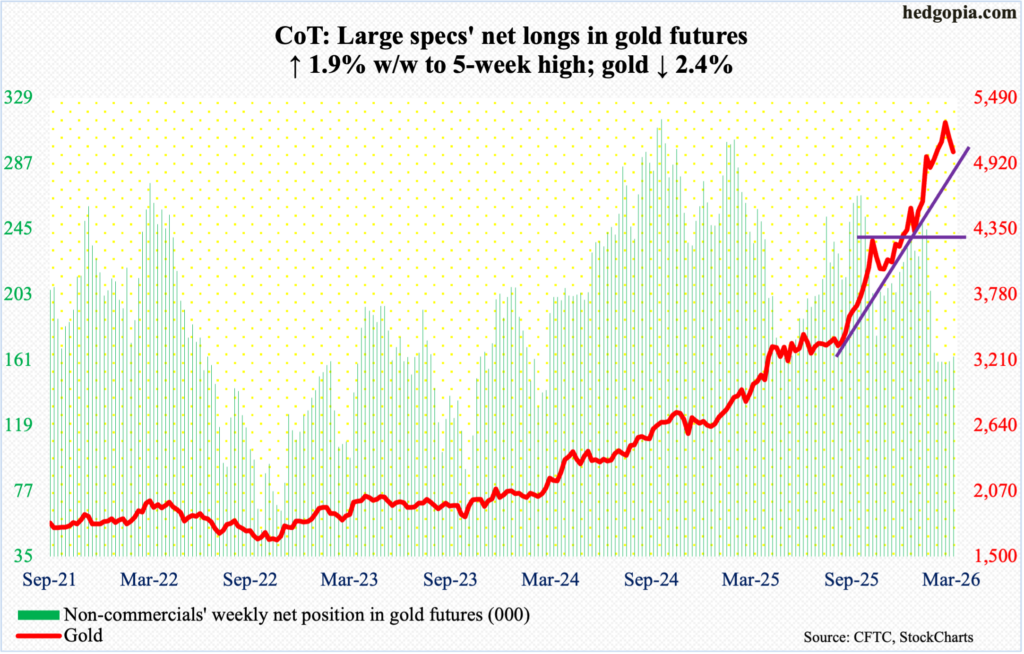
Last week, gold set a lower high of $5,419 versus its all-time high of $5,608 posted on 29 January. This week, it shed 2.4 percent to $5,022/ounce. March is halfway through, and it is down 4.9 percent; if it sticks, this would be a first monthly drop in eight months; in fact, over 29 months, there have only been five down months. In October 2023, gold bottomed at $1,810.
This week’s drop comes amidst a volatile week for risk assets. Gold bugs, having had a phenomenal time for quite some time, are now struggling to rally the metal even amidst bad news. The good news from their perspective is that they were able to defend horizontal support at $4,370s right after peaking in late January. Odds favor $4,370s will be tested again in due course, a loss of which will open the door to the next layer of support at $3,900, and then $3,440s.
Nasdaq (mini): Currently net long 24.9k, up 22.5k.
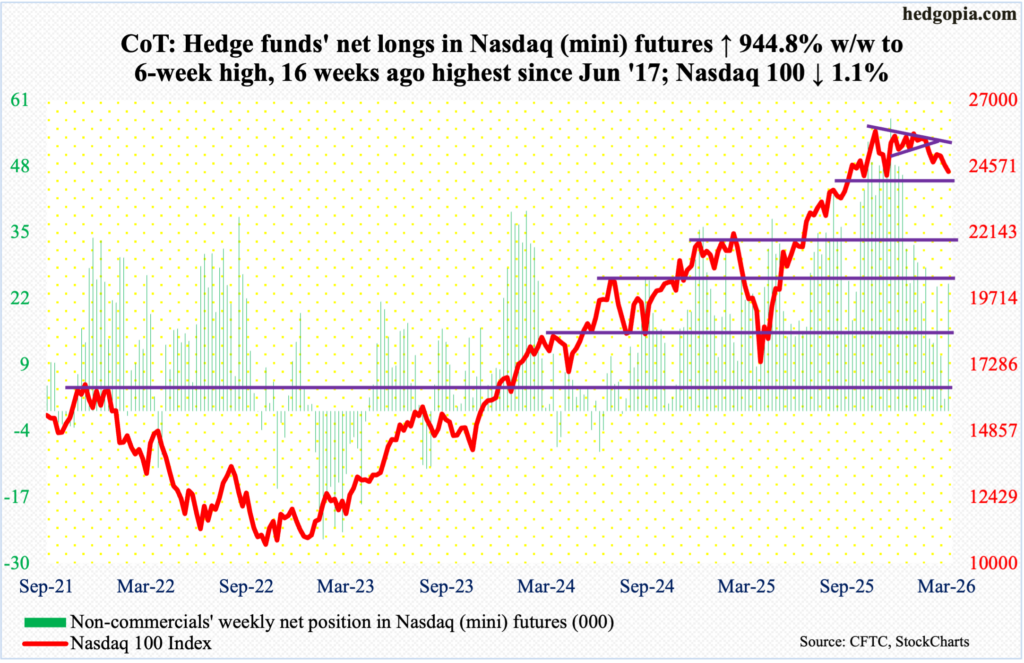
The Nasdaq 100 has been above the 200-day for 10 months now. It has traded just above the average since early this month. This week, it dropped 1.1 percent to 24381, with the average at 24284.
In essence, since losing the 50-day in early February, the tech-heavy index has struggled to get going. Bulls have been on the receiving end since 28 January when the Nasdaq 100 was rejected coming within 17 points of the all-time high 26182 recorded on 29 October.
This week’s gravestone doji on the weekly follows back-to-back spinning tops. Earlier, the index shot up 58 percent between the intraday low of 16542 on 9 April and the October high. There is a long way to go on the downside on the monthly.
Amidst all this, straight-line support at 24500 has been breached but not by a whole lot. This gives the bulls an opportunity to put their foot down for a rally near term.
Russell 2000 mini-index: Currently net short 27.6k, up 20.8k.
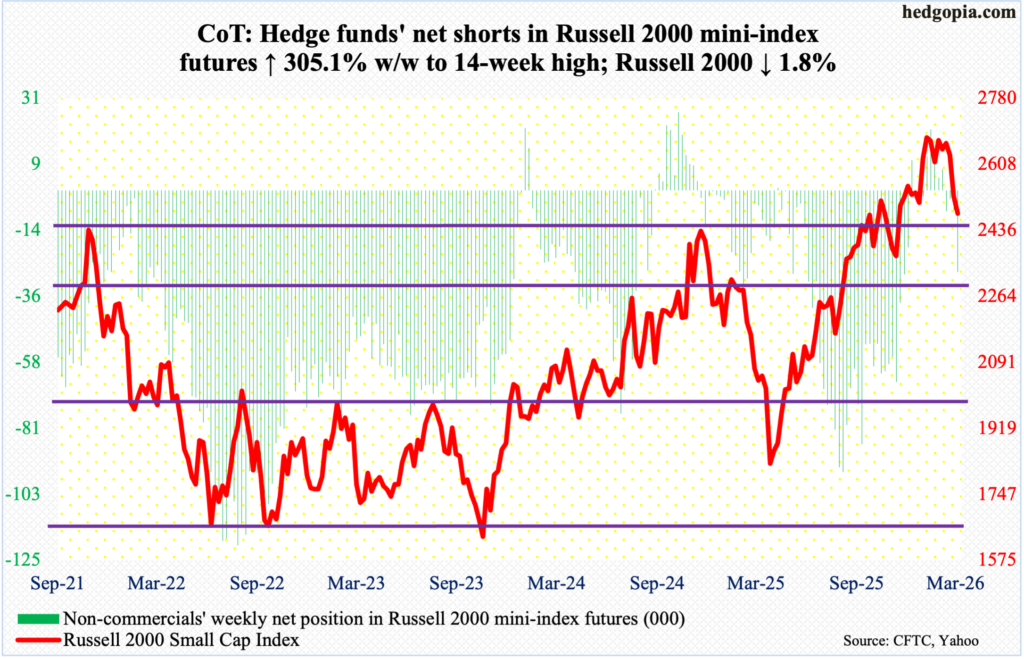
Small-cap bulls, having failed last week to defend breakout retest at 2540s, this week were forced to defend another crucial level.
In November 2024, the Russell 2000 retreated after ticking 2466. Three years before that, in November 2021, it rose to 2459 and then went the other way. Last September, those highs were surpassed, but not before a stretched bull-bear tug of war followed around those highs. This week opened with Monday’s intraday tag of 2463, followed by aggressive buying that pushed the index all the way to 2554. But Monday’s strength did not sustain itself. By Friday, the small cap index gave back 1.8 percent for the week to 2480 – not too far away from 2460s.
Earlier on 22 January, the Russell 2000 peaked at 2735, before making a series of lower highs, followed by a loss of crucial support at 2540s. Failure to save the support will expose the index to a test of the 200-day at 2419. It is already under the 50-day at 2623.
US Dollar Index: Currently net short 5.9k, up 893.
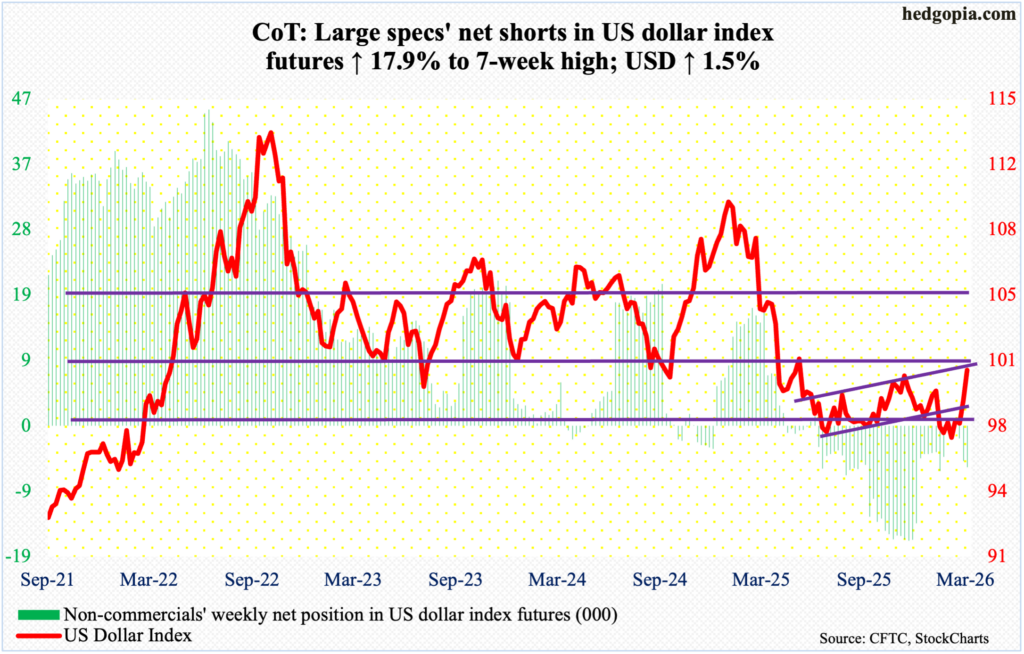
The US dollar index has reached a crucial stage, rallying 1.5 percent this week to 100.50. Resistance just north of 100 goes back more than a decade. Dollar bulls lost the level last April.
In January last year, after a three-plus-month rally, the US dollar index reversed hard at 110.18, subsequently reaching 96.38 in June and successfully testing that low with a lower low 96.22 in September. On 27 January, another lower low 95.55 was ticked, and that was embraced by the bulls, ending the week with a weekly dragonfly doji.
With the January (this year) low in place, the index has come a long way. More could be in store once 100-plus gets definitively taken out. Bulls deserve the benefit of the doubt, except the daily is stretched in the near term.
VIX: Currently net short 42.8k, down 12.9k.
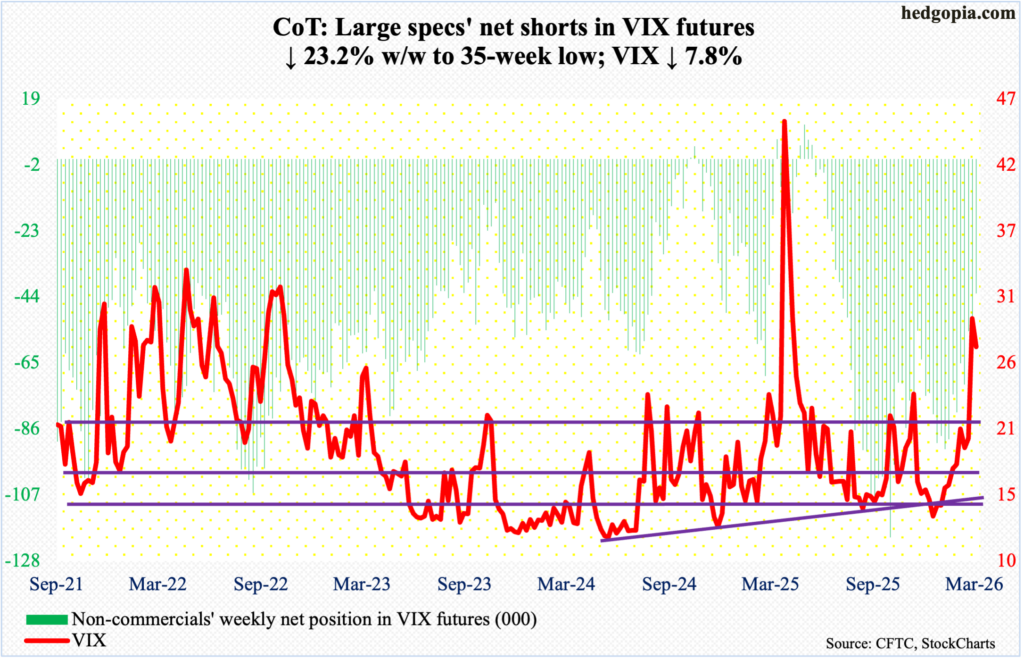
On the monthly, VIX acts as if it can go a lot higher in due course. Right here and now, however, the volatility index is giving out signs of exhaustion.
On 27 February, VIX closed at 19.86. This Monday, it ticked 35.30 intraday before closing at 25.50, reversing lower 2.30 points for the week to 27.19. Concurrently, weekly RSI is turning lower after kissing 70.
In the meantime, non-commercials have been reducing their holdings of net shorts in VIX futures, to 42,835 contracts as of Tuesday, down from 71,817 as of 17 February. If past is prologue, VIX peaks as these traders either go net long or get close to doing that.
Thanks for reading!
