
Following futures positions of non-commercials are as of March 17, 2026.
10-year note: Currently net short 597.9k, up 63k.
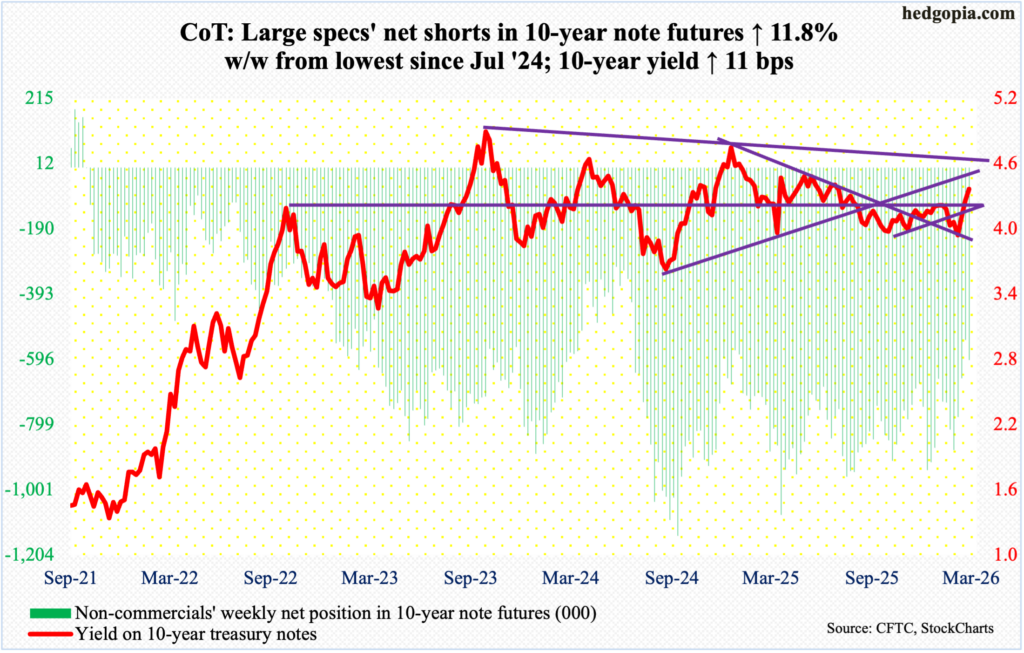
The FOMC (Federal Open Market Committee) held rates as expected. The fed funds rate was left unchanged at a range of 350 basis points to 375 basis points at this week’s meeting. The dot plot continues to point to the possibility of one to two cuts this year, but markets are beginning to disagree. Fed funds futures are pricing in no cut in the remaining six scheduled meetings this year. In fact, the percentage of those expecting a 25-basis-point hike has gone up to mid-single digits. What changed?
Prior to the Iran war, traders had their money on the Federal Reserve resuming easing in June-July, followed by another cut by the end of the year. The Iran conflict, and the resultant spike in oil prices, has turned this supposition on its head. In the futures market, the next cut is not expected until September next year, although this better be taken with a grain of salt, as a lot can happen in the intervening year and a half.
At the end of the two-day FOMC meeting on Wednesday, Chair Jerome Powell explicitly said the Iran conflict would push up near-term inflation. The inflation outlook is no longer benign. The longer this sustains, the more the room for a downside surprise on the economy and an upside surprise on prices. In this scenario, it is just a matter of time the rise in energy prices creeps into the core.
In this environment, it is only fitting the Fed errs on the side of caution and enters a holding pattern – neither tightening nor loosening.
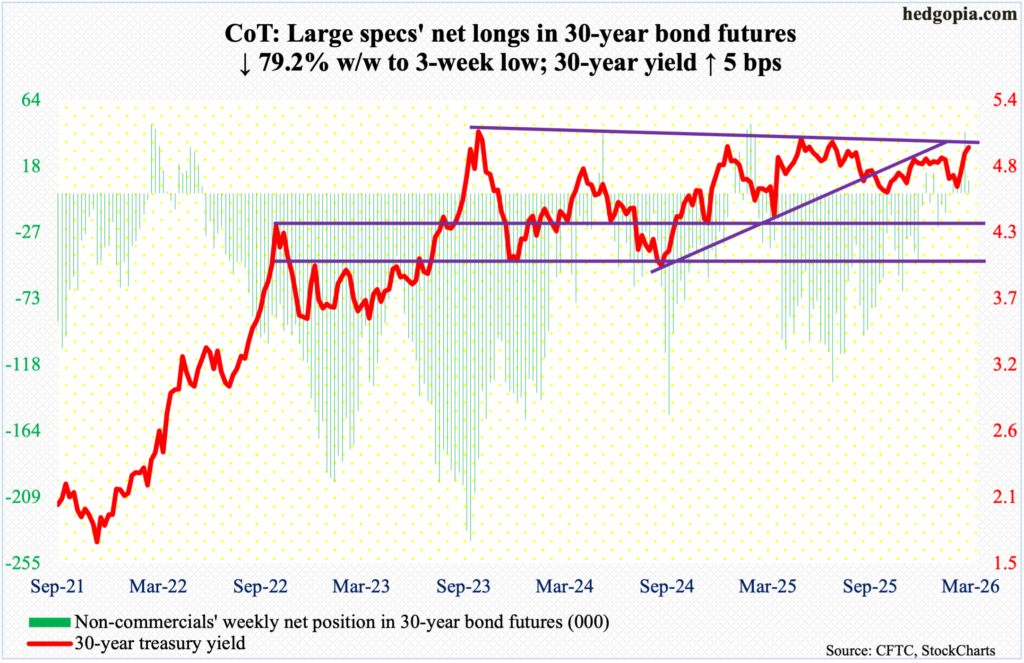
30-year bond: Currently net long 8.8k, down 33.3k.
Major US economic releases for next week are as follows.
Labor productivity (4Q25, revised) will be out Tuesday. Preliminarily, non-farm output per hour in the fourth quarter increased 2.8 percent from a year ago. This was a five-quarter high.
Friday brings University of Michigan’s consumer sentiment index (March, final). March’s preliminary reading showed consumer sentiment dropped 1.1 points month-over-month to 55.5 – a three-month low. Last November’s 51 was just a point higher than the June 2022 record low of 50.
WTI crude oil: Currently net long 185.9k, down 16.1k.
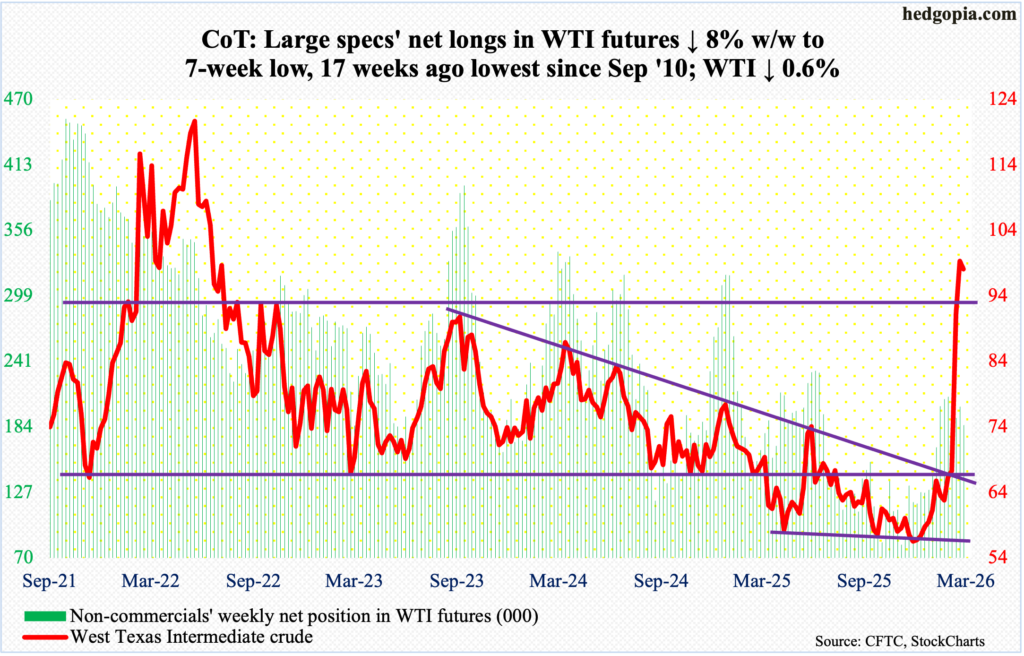
Oil bulls were unable to hang on to the intraday high of $119.48 on the 9th but defended $92 and change – an important price point going back many years – several times this week. West Texas Intermediate crude gave back 0.6 percent this week to $98.09/barrel. This comes after gains of 9.3 percent last week and 36.2 percent in the week before that.
The Middle East conflict is yet to sniff a ceasefire, but oil is beginning to adjust lower. The crude remains overbought on the weekly. In the week it tagged $119.48, which is the highest price point since the March 2022 high of $126.42, WTI formed a wide-ranging spinning top on the weekly. Once $92-and-change is beached, bulls and bears are likely to lock horns around $88.
In the meantime, as per the EIA, US crude production in the week to March 13 decreased 10,000 barrels per day week-over-week to 13.668 million b/d; output registered a record 13.862 mb/d in the week to November 7 last year. Crude imports increased 772,000 b/d to 7.2 mb/d. As did crude inventory, which grew 6.2 million barrels to 449.3 million barrels. Stocks of gasoline and distillates went the other way, down 5.4 million barrels and 2.5 million barrels to 244 million barrels and 116.9 million barrels respectively. Refinery utilization rose six-tenths of a percentage point to 91.4 percent.
E-mini S&P 500: Currently net short 113.1k, down 21.4k.
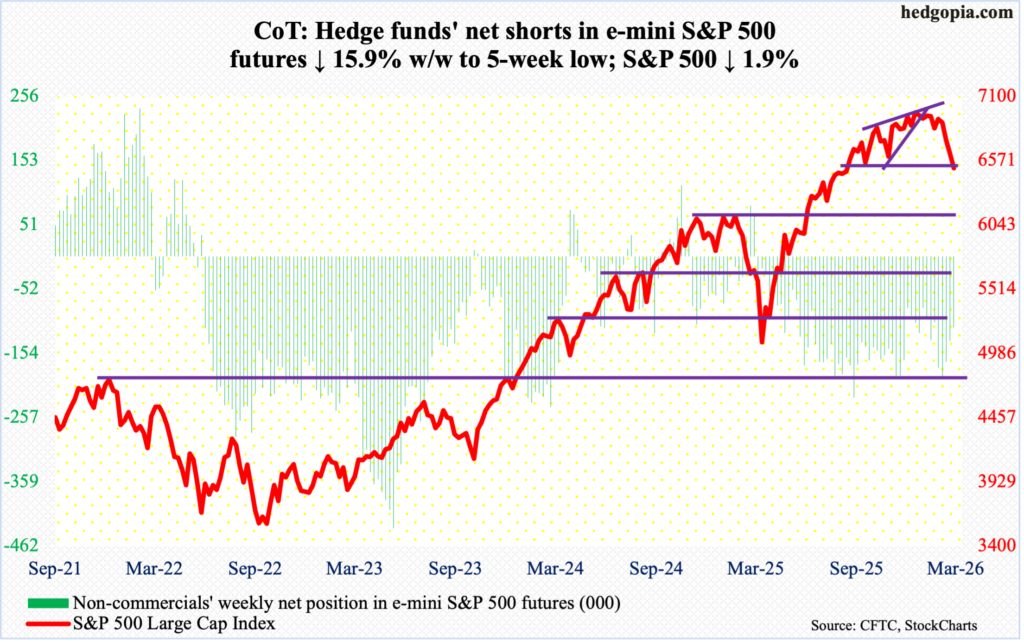
Equity bulls put their foot down early in the week, but only to meet with aggressive sellers at resistance. By Tuesday, the S&P 500 was up as much as 1.8 percent for the week when it ticked 6754 intraday. Straight-line resistance at 6770s goes back five months, and sellers pounced on the opportunity. By Thursday, the 200-day (6622) was gone, with the index moving further away from the average on Friday closing at 6506, down 1.9 percent for the week. This was the fourth consecutive down week. As a matter of fact, since the large cap index posted a new all-time high 7002 on 28 January, there has only been one up week in seven.
Understandably, several technical indicators are extended way to the downside, with the daily RSI closing just under 30. This creates room for a relief rally. Should one emerge in the sessions ahead, the question is that of durability and the trigger. As things stand, a ceasefire in the Iran conflict – or any hints of it – can act as a trigger and will force the shorts to cover. In this scenario, the 200-day is the one to watch, and after that 6770s. If selling continues, there is minor support at 6420s; last Friday, the S&P 500 tagged 6474 intraday.
Euro: Currently net long 21.1k, down 84k.
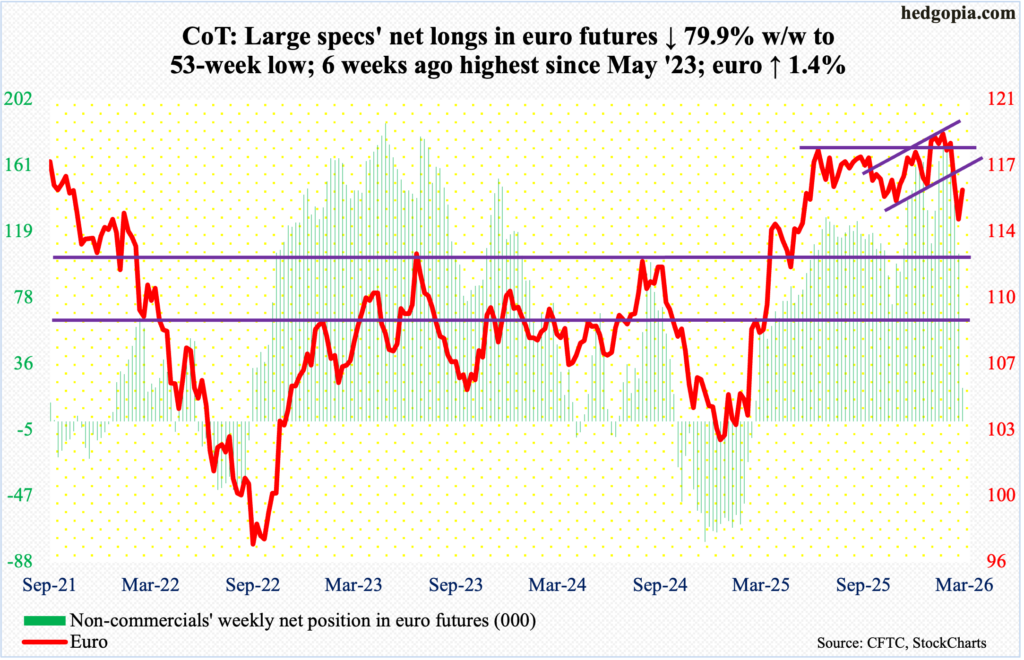
Non-commercials are giving up. In the week to 10 February, they were net long 180,305 contracts, before they began to cut back. As of this Tuesday, they had reduced their holdings to 21,132 – a 53-week low.
The spot has been under pressure since 27 January when it tagged a four-and-a-half-year high $1.208 and reversed lower; in the week in which that reversal happened, a weekly gravestone doji formed. In January last year, the euro bottomed at $1.018.
Last week, the currency sliced through horizontal support at $1.15s, raising the odds it was possibly headed toward $1.11-$1.12. But with non-commercials having meaningfully reduced their net long exposure, the euro began the week with Monday’s session low $1.141 – just about matching last Friday’s low – drawing bids. By Friday, it was up 1.4 percent for the week to $1.157, reclaiming $1.15s.
There is room for further rally. The 200-day is at $1.168, and the 50-day at $1.173.
Gold: Currently net long 159.9k, down 3.3k.
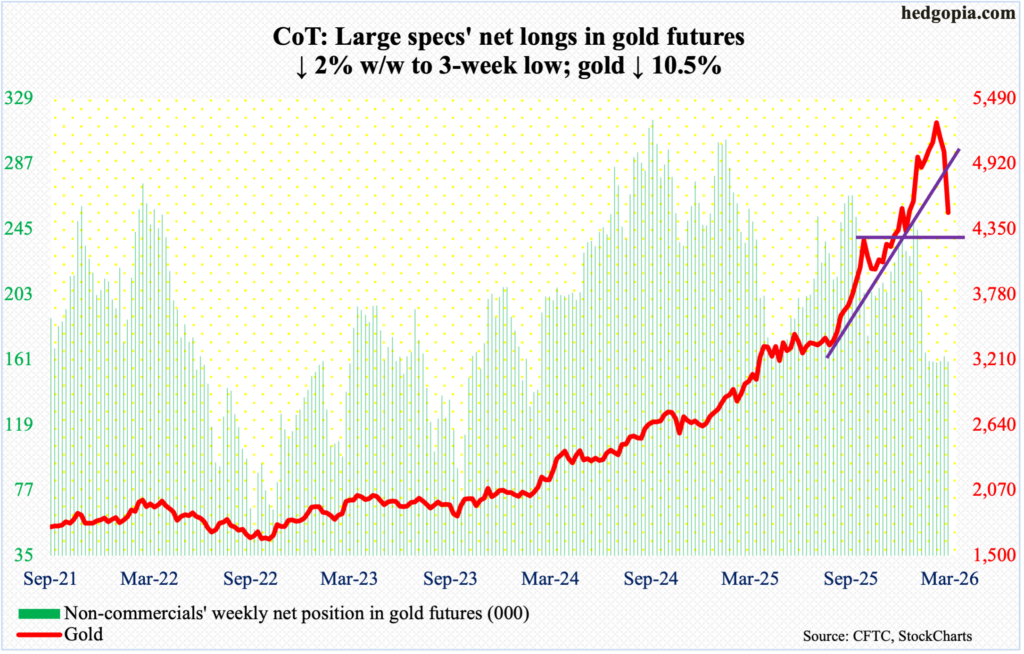
Gold is headed for a test of $4,370s, which was successfully tested on 2 February with an intraday low of $4,405. Two sessions before that – on 29 January – the metal reached an all-time high $5,608, followed by a lower high $5,419 on the 2nd this month.
This week, gold tumbled 10.5 percent to slice through the 50-day ($4,964) to $4,494/ounce. Ahead, should gold bugs be unable to defend the early-February low – or $4,370s – then the yellow metal in due course will probably gravitate toward the 200-day at $4,067.
Nasdaq (mini): Currently net long 24.1k, down 847.
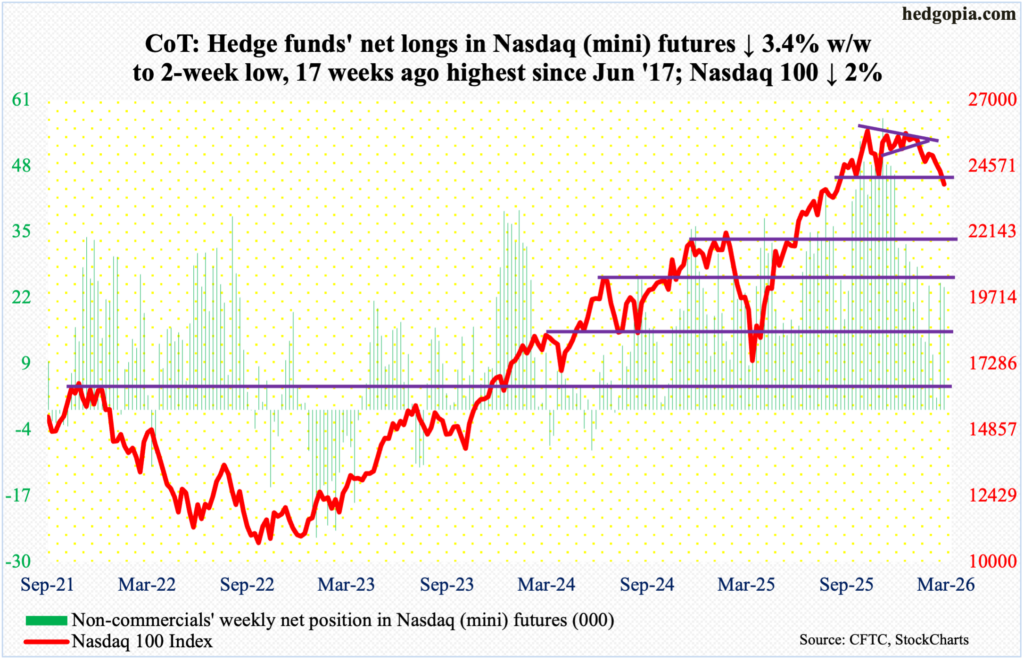
Tech bulls could no longer hold the 24500 fort, nor could they save the 200-day (24359). Prior to this week, the Nasdaq 100 had been above the average for 10 months, loitering just above it since early this month.
This week, the index dropped two percent to 23898, down 8.7 percent – and down 9.3 percent from Friday’s low – from the all-time high 26182 recorded on 29 October. On 28 January, it came within 17 points of that high before facing rejection; including the week in which that rejection took place, the tech-heavy index has been down in seven of eight weeks.
If things do not stabilize soon or the negative momentum deepens, then the next support is not until 23000, followed by crucial horizontal support at 22100s.
Russell 2000 mini-index: Currently net short 33.1k, up 5.9k.
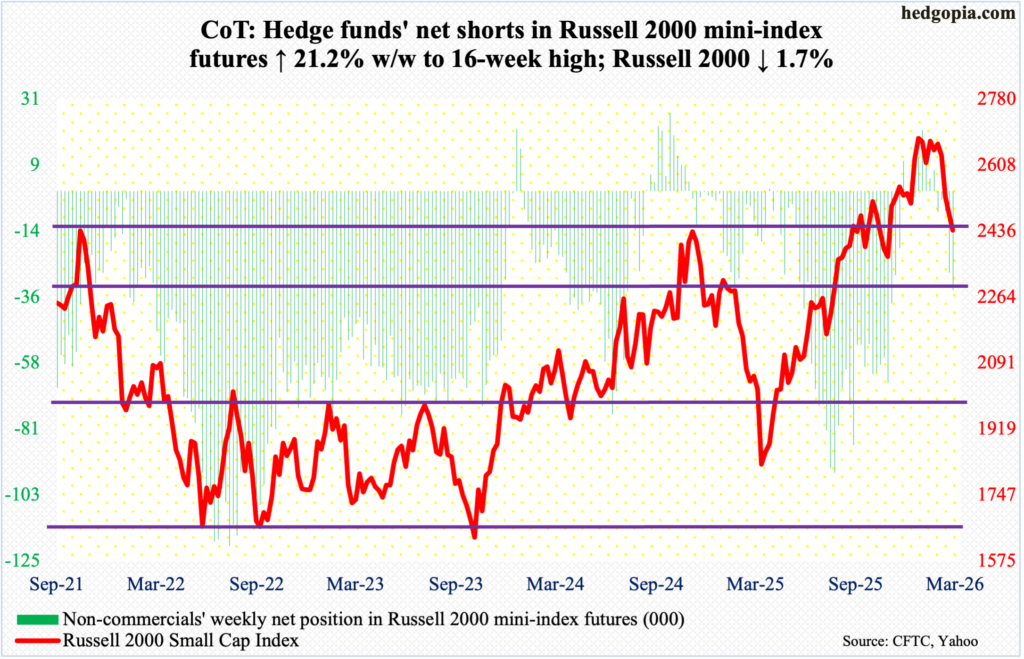
The Russell 2000 – unlike the S&P 500 and Nasdaq 100 – is yet to lose its 200-day (2429), although it would have done so if Friday’s session low 2423 held; but it did not, as the small cap index declined 1.7 percent for the week to 2438. It did, however, failed breakout retest at 2460s. A couple of weeks ago, small-cap bulls failed to defend breakout retest at 2540s.
In November 2024, the Russell 2000 retreated after ticking 2466. Three years before that, in November 2021, it rose to 2459 and then went the other way. Last September, those highs were surpassed, but not before a stretched bull-bear tug of war followed around those highs. Hence the significance of 2460s.
Earlier on 22 January, the index peaked at 2735, before making a series of lower highs, followed by the loss of 2540s, and now 2460s. Failure to hold on to the 200-day will make the index vulnerable to a drop toward 2300.
US Dollar Index: Currently net long 3.7k, up 9.6k.
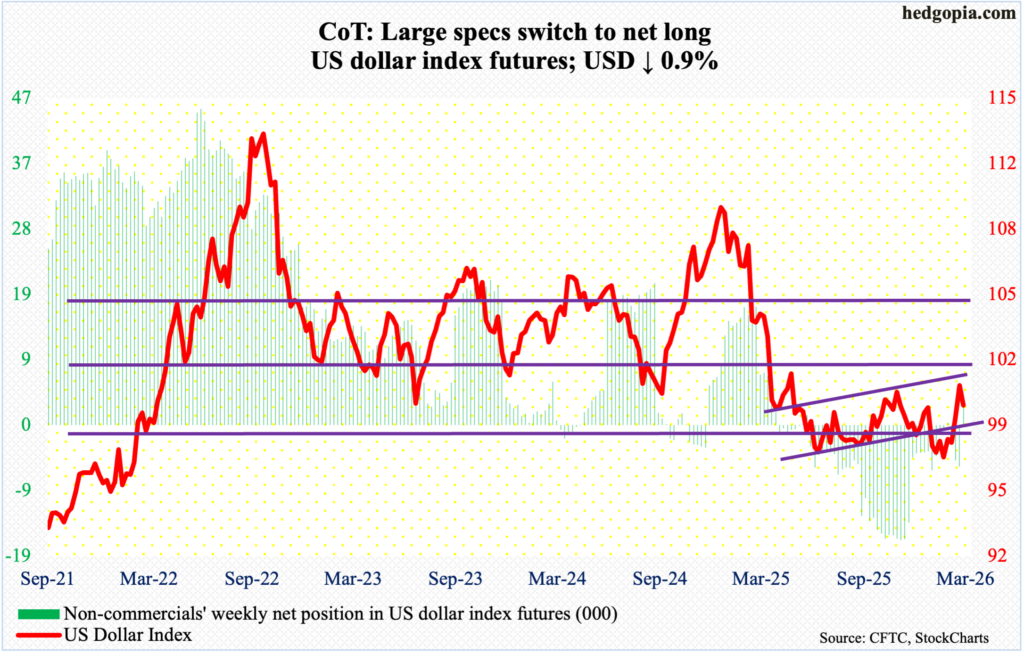
Dollar bulls could not quite pull it off. Resistance just north of 100 goes back more than a decade, and it was lost last April. This week, the US dollar index reversed hard lower after ticking 100.48 on Monday – just short of last Friday’s intraday high 100.50 – closing the week down 0.9 percent to 99.50.
In January last year, after a three-plus-month rally, the index reversed hard at 110.18, subsequently reaching 96.38 in June and successfully testing that low with a lower low 96.22 in September. On 27 January, another lower low 95.55 was ticked, and that was embraced by the bulls, ending the week with a weekly dragonfly doji. On the back of that trough, the US dollar index rallied nicely and needs a breather now. There is support just under 98.
VIX: Currently net short 46.4k, up 3.6k.
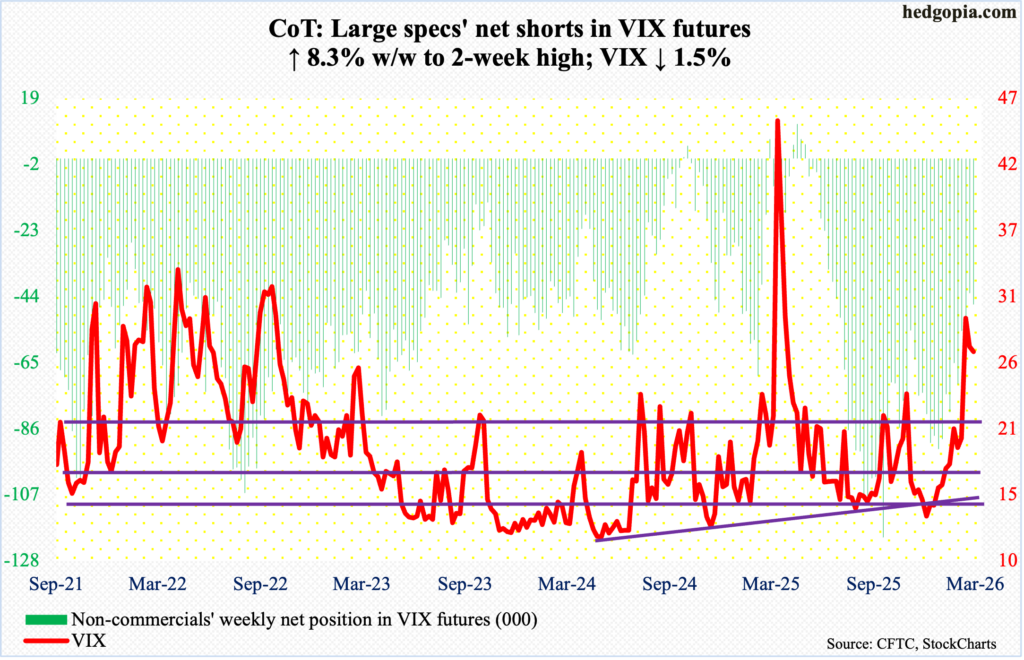
For the second week running, VIX is sending out vibes that it expects things to improve in Iran. This week, the volatility index fell 0.41 points to 26.78. Last week, it reversed lower after ticking 35.30 on Monday to close the week down 2.30 points to 27.19. In both weeks, the S&P 500 came under decent pressure. Historically, the two tend to move in opposite directions.
On the monthly, VIX acts as if it can go a lot higher in due course. Near-term, however, weekly RSI just turned lower after kissing 70. A rising trendline from Christmas Eve when it ticked 13.38 intraday gets tested just north of 19.
Thanks for reading!
