
Following futures positions of non-commercials are as of March 24, 2026.
10-year note: Currently net short 641.9k, up 44k.
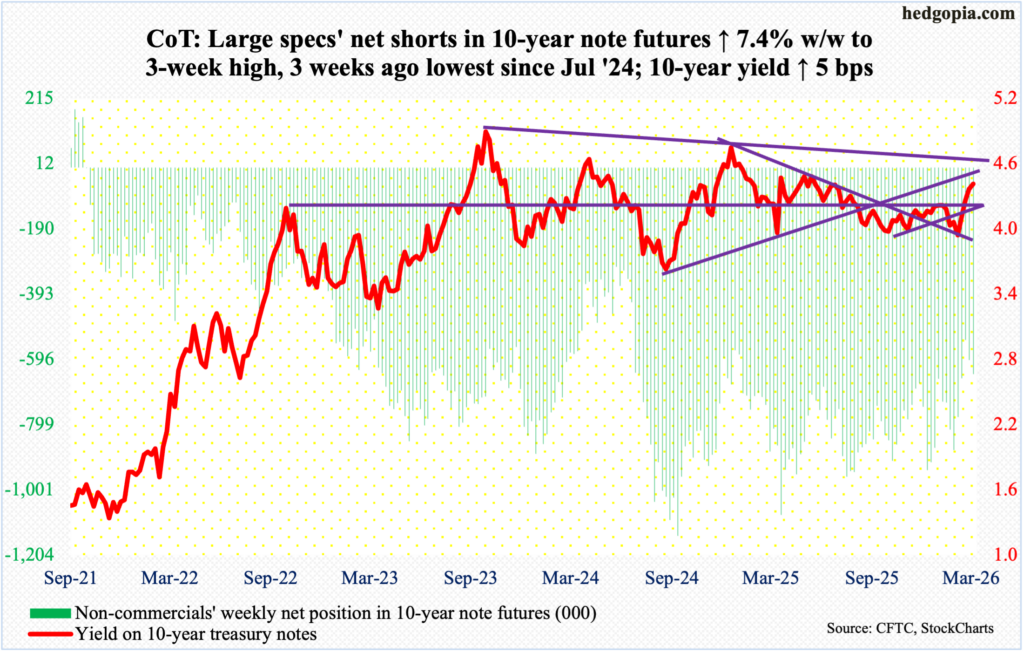
Borrowing costs are rising – on the long end. The 10-year treasury yield has gone from an intraday low of 3.96 percent on 27 February to Friday’s 4.48 percent, even as the fed funds rate on the short end has remained anchored at a range of 3.50 percent to 3.75 percent. For the week, the 10-year rose five basis points to 4.44 percent, with Friday’s intraday high the highest since last July.
Friday’s high also kissed a falling trendline from October 2023 when the 10-year peaked at a 16-year-high five percent, followed by lower highs of 4.81 percent in January last year and 4.63 percent in May. Odds favor this resistance holds for now.
Since late February when bond bears (on price; yield and price hold an inverse relationship) defended crucial horizontal support at 3.95s, yields have come a long way – past both the 50- and 200-day moving averages. That support goes back at least a couple of decades and forms the lower support line of a descending triangle spanning two and a half years. This tends to be a bearish chart pattern; that said, it can also act as a reversal pattern, in which case yields will have to break out of the downtrend line in question and establish higher highs.
It is of course too soon to say for sure where things are headed but suffice to say that the probabilities for the 10-year yield coming under downward pressure – if nothing else just to unwind the overbought condition the rates are in – are very high in the near term.
Non-commercials, in the meantime, are still heavily exposed to the short side and are positioned to benefit from higher rates.
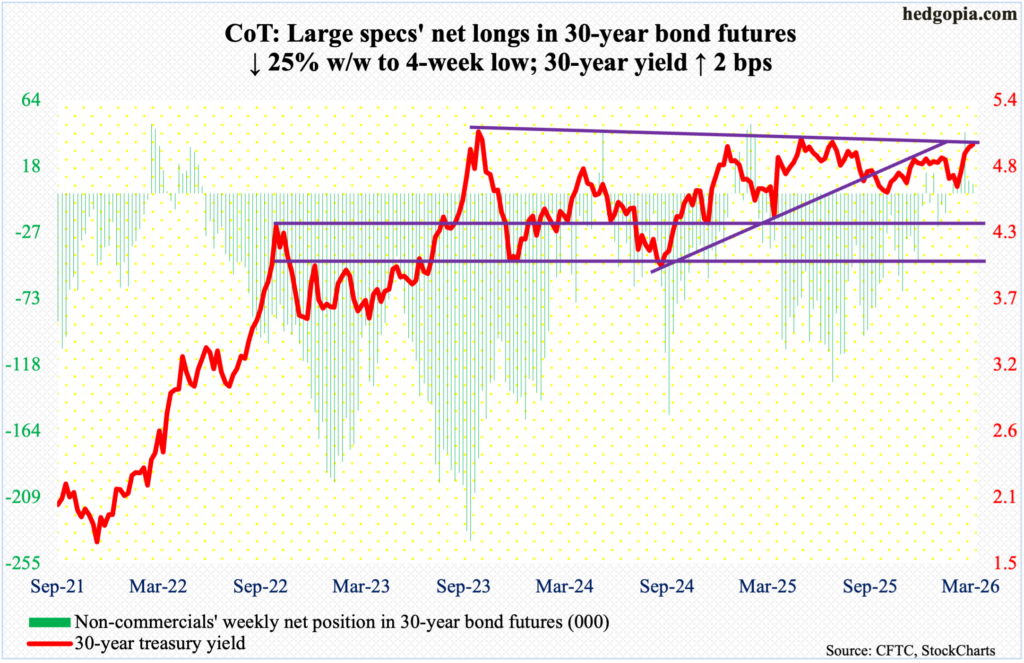
30-year bond: Currently net long 6.6k, down 2.2k.
Major US economic releases for next week are as follows. Markets are closed Friday for observance of Good Friday.
The S&P Case-Shiller home price index (January) and job openings (JOLTs, February) come out Tuesday.
Nationally, home prices gained 1.3 percent in December from a year ago. This was the slowest year-over-year price appreciation since July 2023.
Non-farm job openings jumped 396,000 month-over-month in January to 6.9 million. December’s 6.6 million was the lowest since September 2020, with the series peaking at 12.3 million in March 2022.
Retail sales (February) and the ISM manufacturing index (March) are on schedule for Wednesday.
January retail sales were down 0.2 percent m/m to a seasonally adjusted annual rate of $733.5 billion. This was the second straight m/m drop since sales reached a record $734.7 billion last November.
In February, manufacturing activity shrank two-tenths of a percentage point m/m to 52.4 percent. This was the second consecutive 50-plus reading since January last year.
Friday brings payrolls (March) and the ISM services index (March).
The economy lost 92,000 non-farm jobs in February. This was the sixth monthly loss of jobs in the last 14 months. In all of 2025, an average 10,000 jobs were created every month, versus gains of 122,000 in 2024, 210,000 in 2023 and 377,000 in 2022.
Non-manufacturing activity in February jumped 2.3 percentage points m/m to 56.1, which is the highest reading since July 2022.
WTI crude oil: Currently net long 197.3k, up 11.5k.
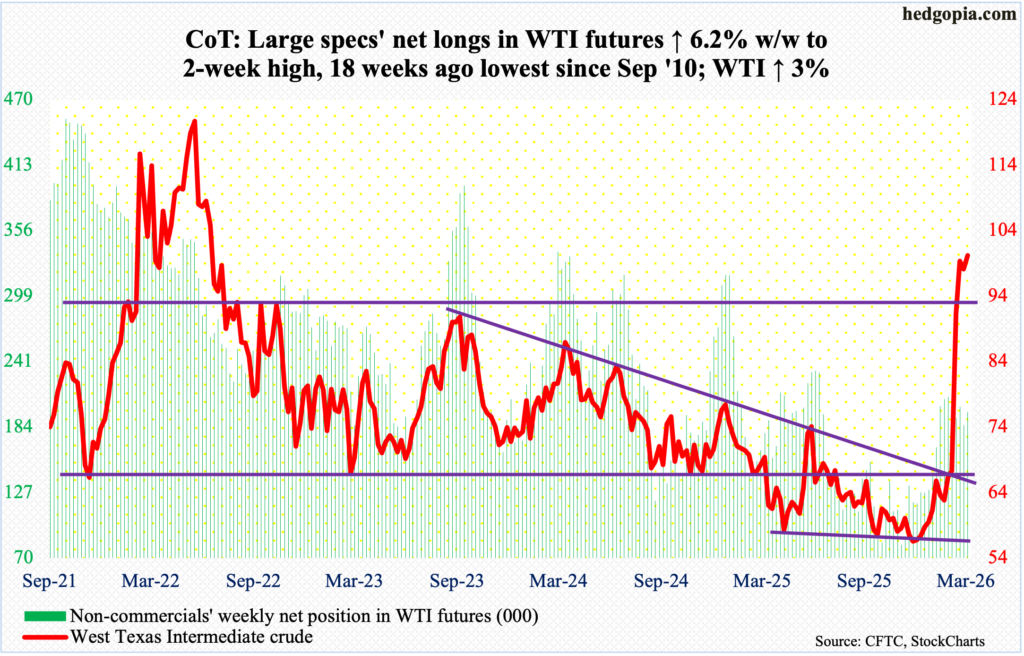
The current backwardation in the oil futures curve, in which spot prices for immediate delivery are higher than more distant futures prices, could be an indication that traders view (1) the problem is transitory and that there would be resolution to the Iran conflict soon and/or (2) there would be a reduction in future demand.
West Texas Intermediate crude rose three percent this week to $101.18/barrel, rallying all along the 20-day. Since bottoming at $54.98 last December, this was the 11th up week in 14. A decisive break above $102 can open the door toward the intraday high of $119.48 posted on the 9th this month; this was the highest price point since the March 2022 high of $126.42.
In the meantime, as per the EIA, US crude production in the week to March 20 decreased 11,000 barrels per day week-over-week to 13.657 million b/d; output registered a record 13.862 mb/d in the week to November 7 last year. Crude imports, too, fell, down 730,000 b/d to 6.5 mb/d. As did gasoline inventory, which declined 2.6 million barrels to 241.4 million barrels. Stocks of crude and distillates respectively increased 6.9 million barrels and three million barrels to 456.2 million barrels and 119.9 million barrels respectively. Refinery utilization rose 1.5 percentage points to 92.9 percent.
E-mini S&P 500: Currently net short 80.9k, down 32.2k.
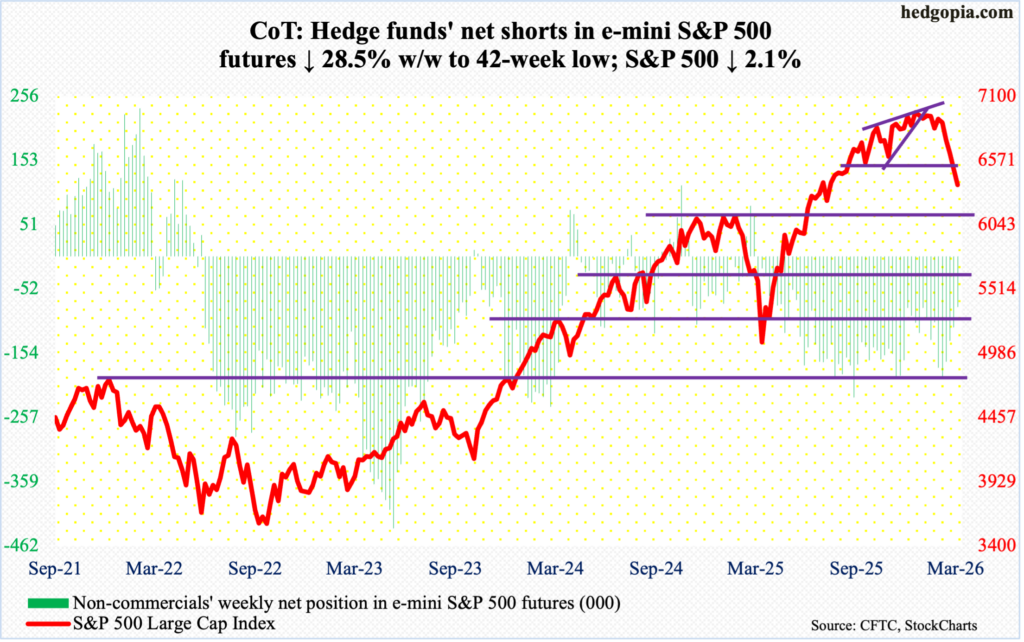
Last week, or nine sessions ago, equity bulls had an opportunity to reclaim 6770s but came up short, as sellers/shorts got active at 6754. This week, the phenomenon repeated itself as longs had an opportunity to recapture the 200-day (6635) as early as Monday but were denied. By the end of the week, the S&P 500 gave back 2.1 percent to 6369. This was the fifth consecutive down week. As a matter of fact, since the large cap index posted a new all-time high 7002 on 28 January, there has only been one up week in eight. Through Friday’s session low 6356, it is down 9.2 percent from that high.
If things do not stabilize soon, there is major support at 6120s. In the event of a relief rally in the sessions ahead, Friday’s gap-down will be filled at 6470s, which can attract selling. At this point, it is bears’ ball to lose.
Euro: Currently net long 9.3k, down 11.9k.
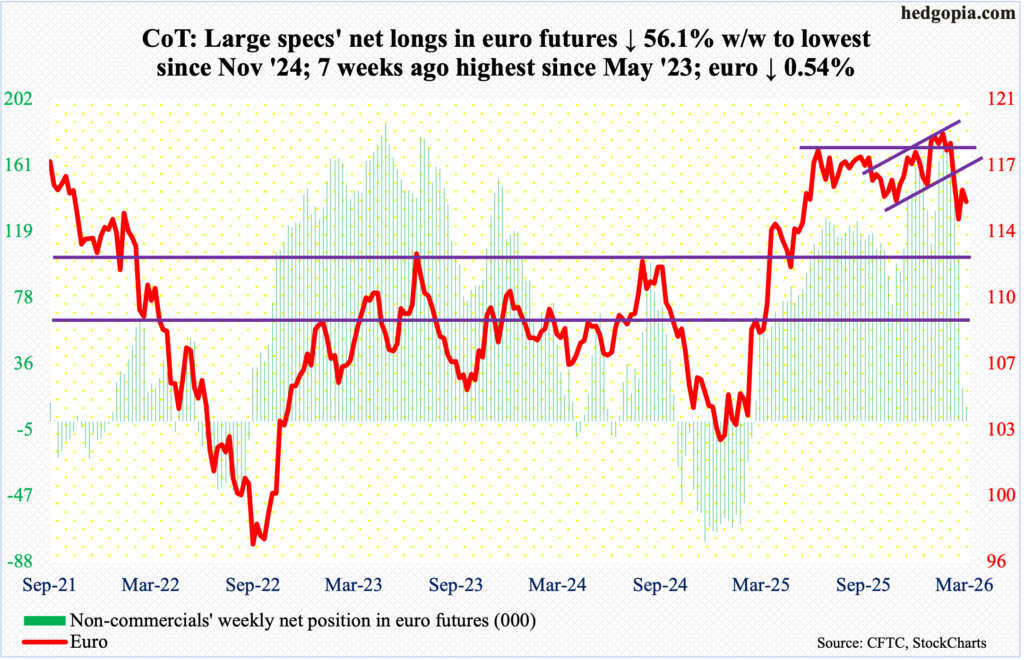
Non-commercials continue to cut back on their holdings of net longs, which are now the lowest since November 2024. In the week to 10 February, they were sitting on 180,305 net longs; as of this Tuesday, this got reduced to 9,279.
The euro has been under pressure since 27 January when it reversed lower after tagging a four-and-a-half-year high $1.208; in the week in which that reversal occurred, a weekly gravestone doji formed. In January last year, the currency bottomed at $1.018.
Ahead, the session low $1.141 from the 13th (this month) is worth watching.
Gold: Currently net long 168.3k, up 8.5k.
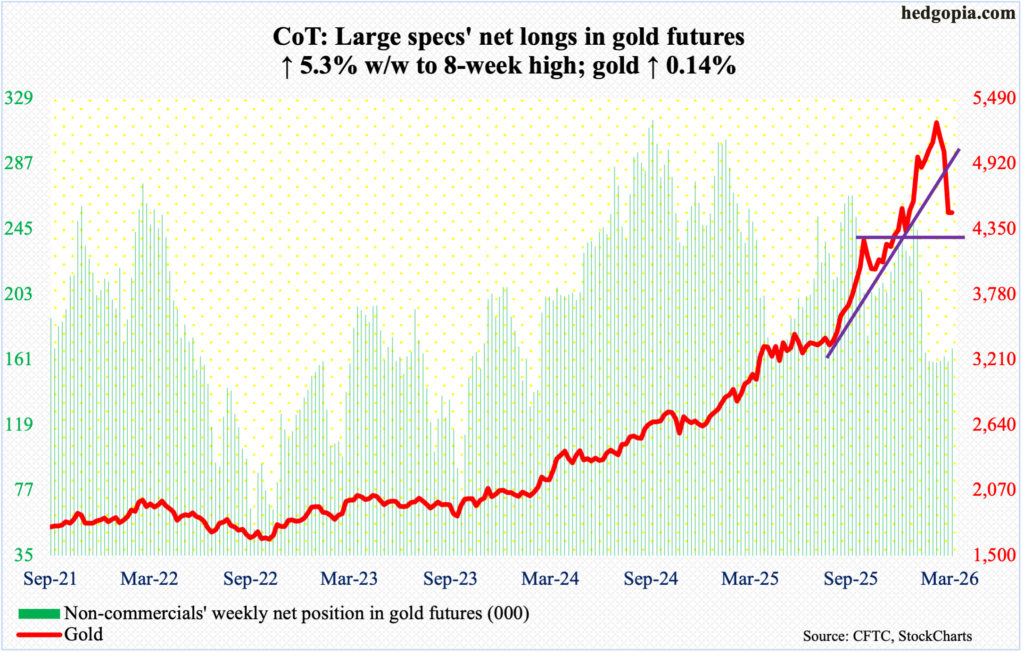
Having sliced through the 50-day ($4,953) last week, gold this week proceeded to test the 200-day ($4,095) with Monday’s session low $4,099 drawing buying interest. The metal inched up 0.1 percent for the week to $4,495/ounce. This also meant gold did not close below $4,370s, which was successfully tested on 2 February with an intraday low of $4,405. Two sessions before that – on 29 January – the yellow metal reached an all-time high $5,608, followed by a lower high $5,419 on the 2nd this month.
Gold bugs’ next test will take place at $4,540s, followed by $4,630s.
Nasdaq (mini): Currently net long 6.6k, down 17.5k.
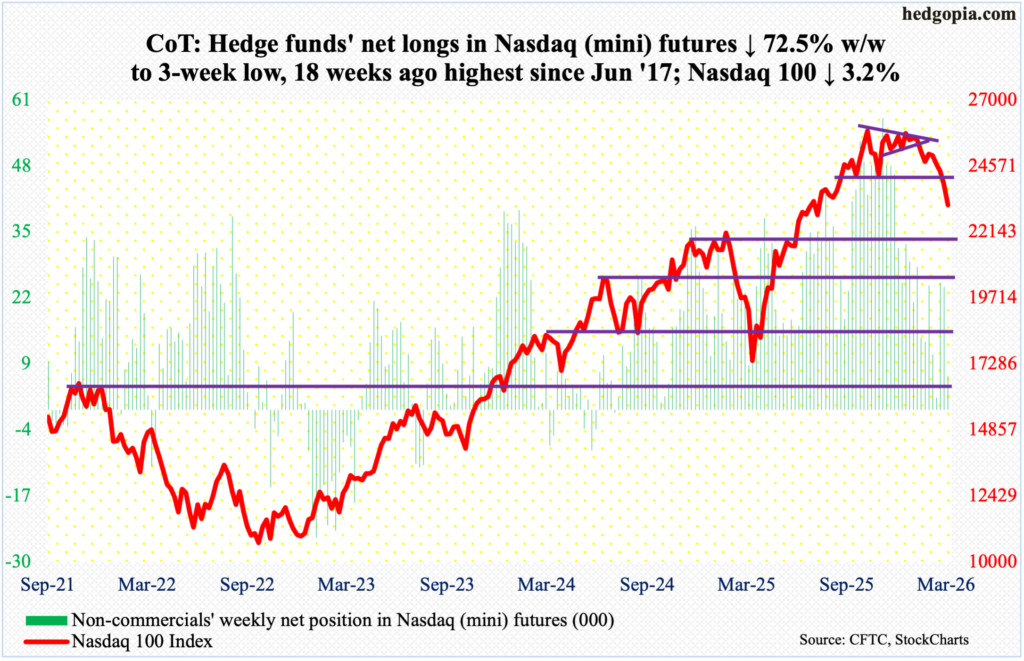
From the all-time high 26182 recorded on 29 October through Friday’s session low 23089, the Nasdaq 100 is down 11.8 percent. Selling accelerated after facing rejection on 28 January coming within 17 points of that high. Including the week in which that rejection took place, the tech-heavy index has been down in eight of nine weeks. This week, it tumbled 3.2 percent to 23133.
Bulls’ attempt on Monday to recapture the 200-day (24411) went nowhere this week, as this was used as an opportunity to sell/short.
There is minor straight-line support at 22900s, followed by make-or-break 22100s.
Russell 2000 mini-index: Currently net short 27.3k, down 6.2k.
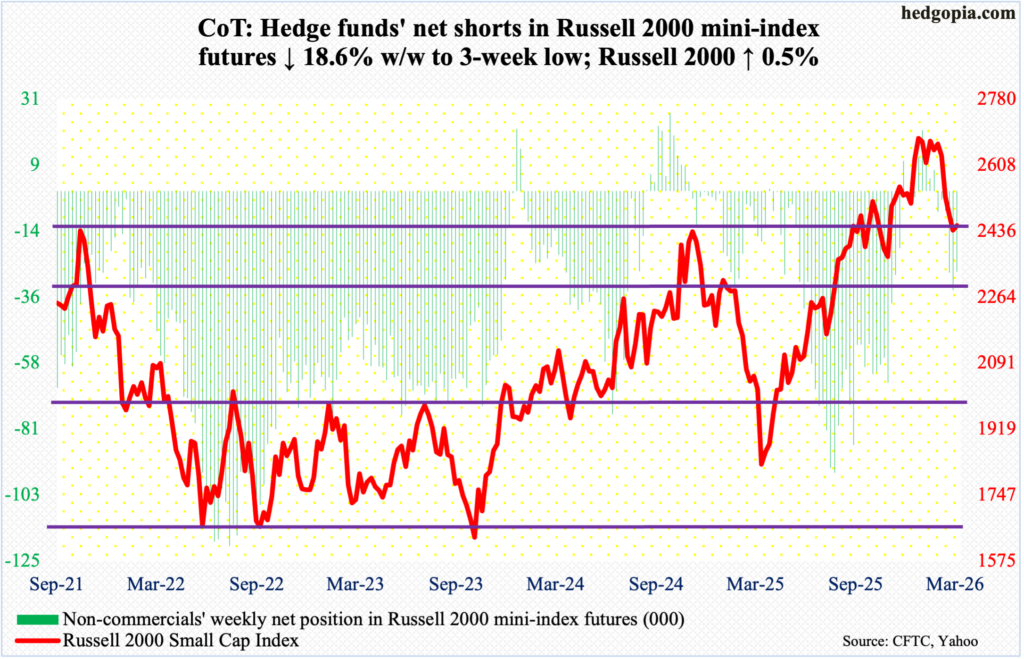
The Russell 2000, up 0.5 percent this week to 2450, continues to hover above its 200-day (2438), although the index was heavily rejected Wednesday when it tried to reclaim 2540s. Three weeks ago, small-cap bulls failed to defend breakout retest at 2540s; this was then followed by breakout retest at 2460s, which until now has not been decisively breached.
The significance of 2460s goes back to November 2021 when the Russell 2000 rose to 2459 and then reversed lower. Three years later, in November 2024, it retreated after ticking 2466. Last September, those highs were surpassed, but not before a stretched bull-bear tug of war followed around those highs.
Prior to the longs’ struggles at 2540s and 2460s, the index peaked at 2735 on 22 January, before making a series of lower highs. Failure – likely – to hold on to the 200-day will make the index vulnerable to a drop toward 2300.
US Dollar Index: Currently net long 3.6k, down 76.
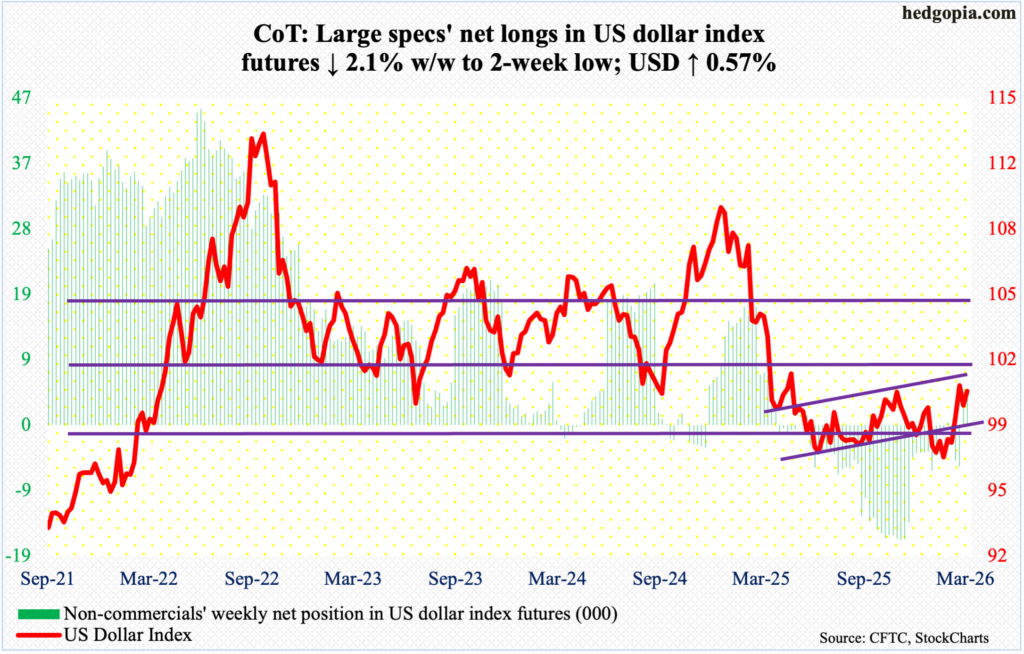
Bulls are back at it again. Resistance just north of 100 goes back more than a decade, and it was lost last April. Last week, the US dollar index reversed hard lower after ticking 100.48 on the 13th, closing the week down 0.9 percent to 99.50. This week, the index added 0.6 percent to 100.21.
In January last year, after a three-plus-month rally, the index reversed hard at 110.18, subsequently reaching 96.38 in June and successfully testing that low with a lower low 96.22 in September. On 27 January, another lower low 95.55 was ticked, and that attracted bids, ending the week with a weekly dragonfly doji, although it remains to be seen if dollar bulls have buying power left to decisively push it past 100-plus.
VIX: Currently net short 25k, down 21.4k.
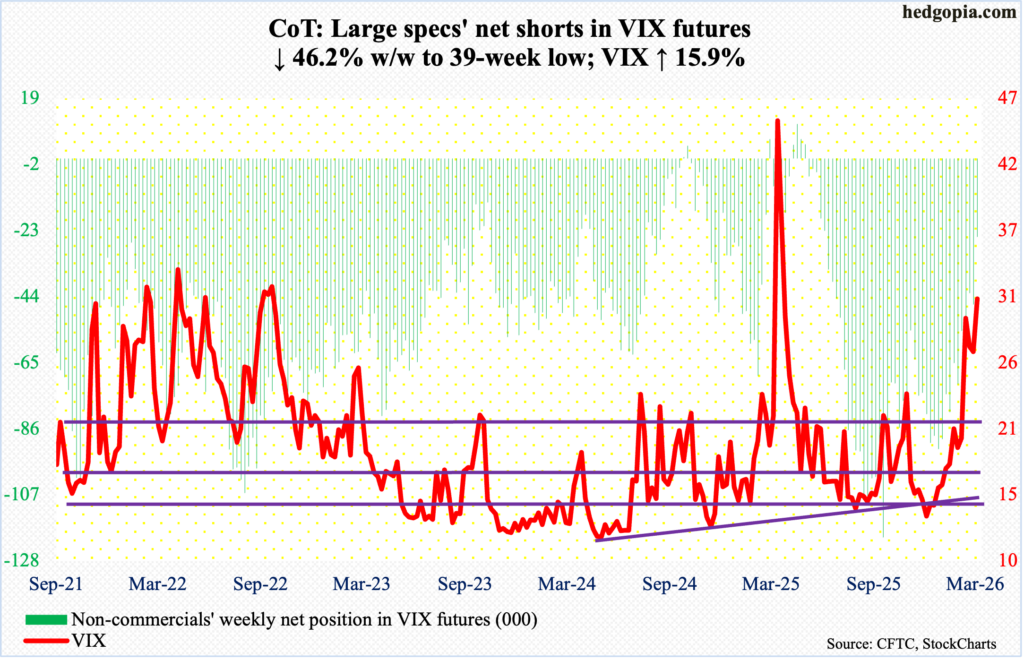
Non-commercials continue to cut back their net longs, with holdings at a 39-week low. If past is prelude, VIX has tended to peak once these traders either go net long or get close to doing that.
On the 9th (this month), the volatility index spiked to 35.30 intraday before reversing to close the week down 2.30 points to 27.19.
This week began with a volatile Monday with a high of 31.04 and a low of 20.28. That low, however, just about tested the 50-day (now 21.08 since the average is sharply ascending); this was also a successful test of a rising trendline from Christmas Eve when VIX ticked 13.38 intraday. With this bullish development, the index finished the week up 4.27 points to 31.05. That said, given where things are, it will be awfully difficult for volatility bulls to take out the spike-reversal high 35.30 in the sessions ahead.
Thanks for reading!
