
Following futures positions of non-commercials are as of June 9, 2026.
10-year note: Currently net short 863.8k, up 34.2k.
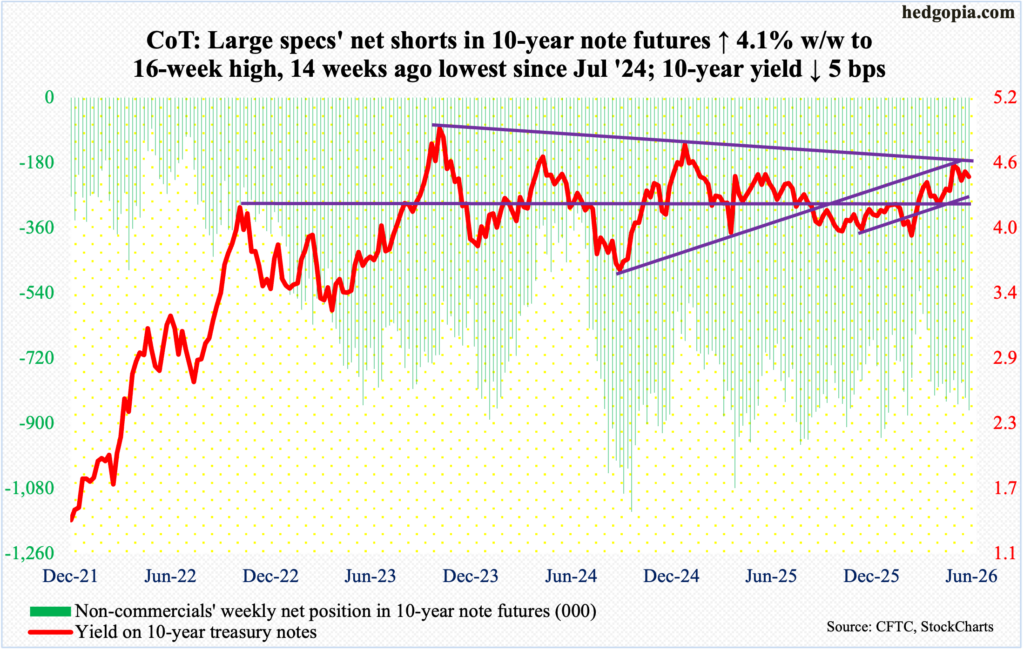
Newly appointed Federal Reserve Chair Kevin Warsh will be chairing an FOMC meeting for the first time next week; the two-day meet begins on the 16th. This will be the fourth scheduled meeting this year, and four more remain.
Leading up to the meeting, markets are expecting the fed funds rate to be left unchanged at a target of 350 basis points to 375 basis points. The benchmark rates have been left there since last December when they were reduced by 25 basis points; this preceded a cut of similar magnitude in September and October. Earlier, rates reached a cycle high 525 basis points to 550 basis points in July 2023, followed by cumulative cuts of 100 basis points over three meetings in 2024.
Futures traders are nearly unanimous in expecting inaction next week. Until just a few months ago, as per the CME FedWatch tool, these traders were pricing in at least a couple of quarter-point cuts this year. This has now been turned on its head. Not only have these easing expectations vanished but the futures are now pricing in a 25-basis-point hike by December.
Inflation numbers have been coming in strong – particularly since February 28 when the U.S. and Israel attacked Iran, causing oil prices to jump. Headline and core CPI for May, published this week, respectively registered year-over-year growth of 4.25 percent and 2.85 percent, setting a 37- and seven-month high, in that order.
Warsh, appointed by President Donald Trump, who heavily criticized Jerome Powell, Warsh’s predecessor, for not lowering rates, has a tough nut to crack. He probably would like to lean dovish but has very little wiggle room, given the current macro data. The FOMC is made up of 12 voting members – seven members of the Board of Governors, New York Fed president, and four of the remaining 11 Reserve Bank presidents who serve for one year on a rotating basis. Of late, regional presidents have sounded hawkish; Warsh’s is just one voice in any decision.
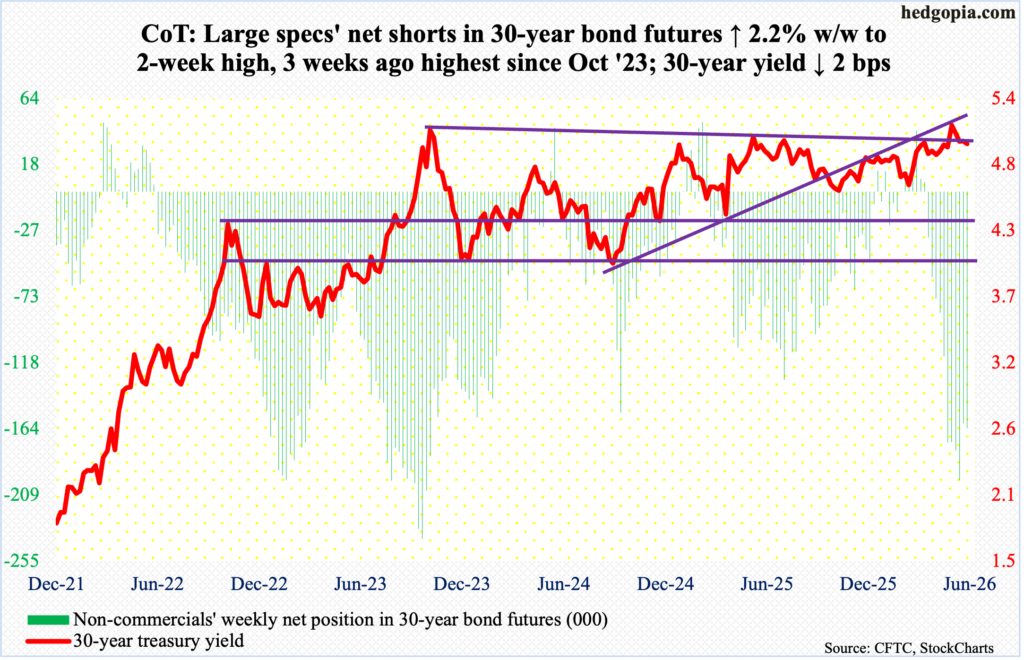
30-year bond: Currently net short 163.3k, up 3.5k.
Major US economic releases for next week are as follows. Markets are closed Friday for observance of Juneteenth holiday.
Industrial production/capacity utilization (May) is due out Monday. Utilization in April increased 0.6 percent month over month to 76.1 percent – a nine-month high.
Housing starts (May) will be published Tuesday. Starts fell 2.8 percent in April m/m to a seasonally adjusted annual rate of 1.47 million units. March’s 1.51 million set a 25-month high.
Retail sales (May) and the NAHB housing market (June) are scheduled for Wednesday.
Retail sales in April grew 0.5 percent m/m to $757.1 billion (SAAR) – a record.
May homebuilder confidence increased three points m/m to 37 – a two-month high. Earlier, in June, August and September last year, the index hit 32, which was the lowest reading since December 2022.
WTI crude oil: Currently net long 133.7k, down 14.3k.
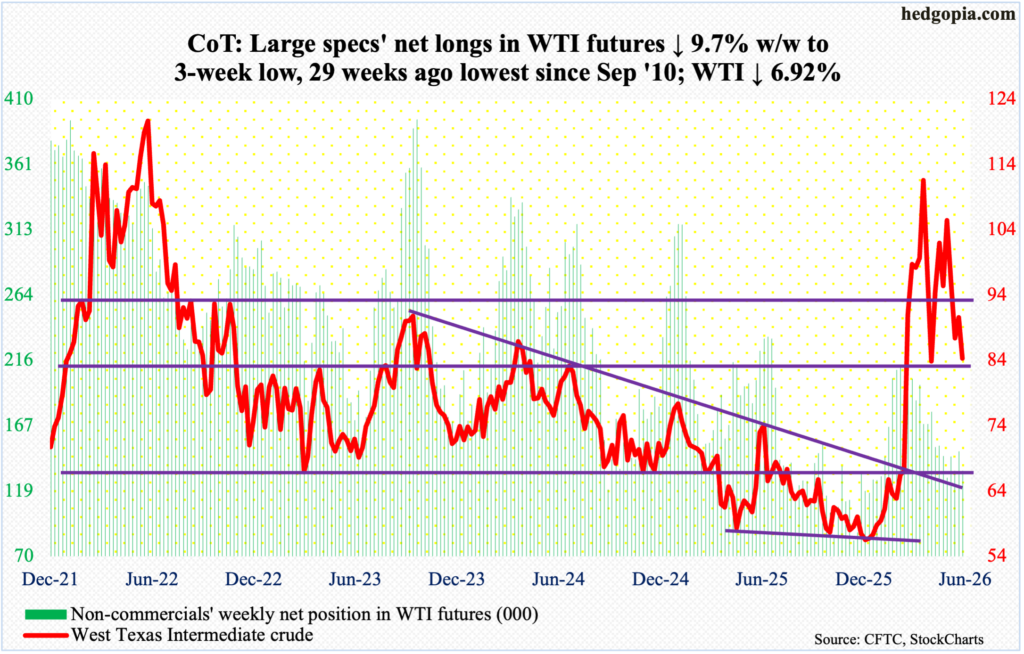
A three-month pattern of lower highs continues in crude. West Texas Intermediate crude hit a four-year high $119.48 on March 9. This followed a sharp jump after the February 28 US-Israeli attack on Iran; On February 27, the crude tagged $64.85 intraday.
The March 9 high was followed by a series of lower highs and higher lows, forming a pennant, which WTI fell out of three weeks ago. This week, it gave back 6.9 percent to $84.27/barrel, with a weekly high of $95.43 posted on Monday.
Eight sessions ago, on Wednesday last week, WTI was rejected just below the 50-day moving average (now $96.48). The 200-day lies at $73.33; the average has not been tested since mid-February, and this seems to be the path of least resistance.
In the meantime, as per the EIA, US crude production in the week to June 5 increased 92,000 barrels per day week over week to 13.799 million b/d; output registered a record 13.862 mb/d in the week to November 7 last year. Crude imports decreased 509,000 b/d to 5.9 mb/d. Stocks of crude and distillates respectively dropped 7.2 million barrels and 200,000 barrels to 426.5 million barrels and 102.1 million barrels; gasoline inventory grew 186,000 barrels to 215.1 million barrels. Refinery utilization rose six-tenths of a percentage point to 95.3 percent.
E-mini S&P 500: Currently net short 205.6k, down 15.1k.
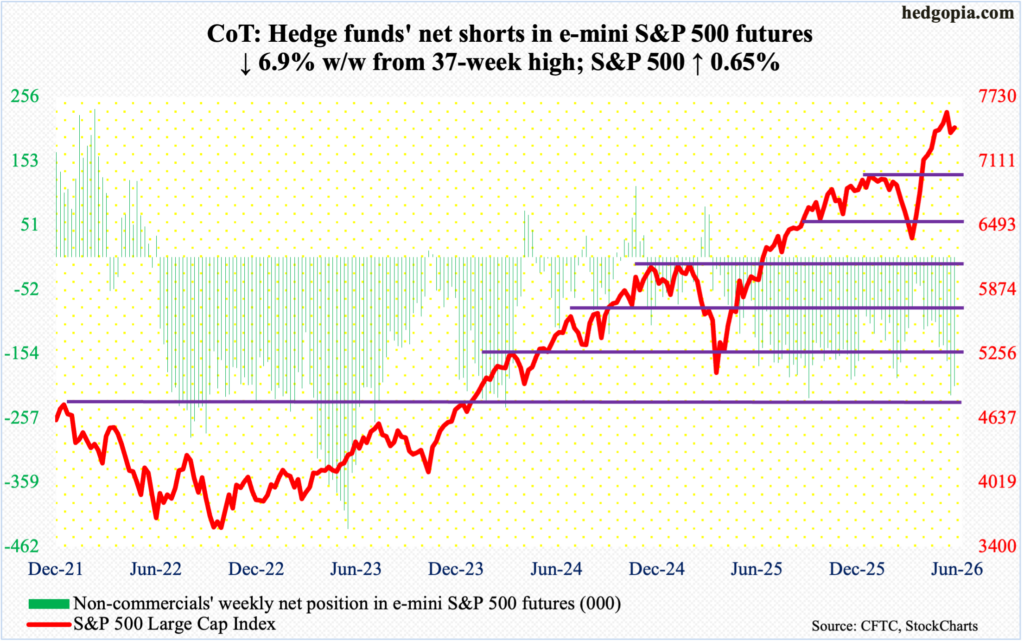
Equity bears essentially picked up where they left off last week, with the S&P 500 down two percent through Tuesday’s intraday low of 7238. This followed last week’s 2.6-percent drubbing. But in the end, bulls had the last laugh, as Tuesday’s low, which took place just above the 50-day (now 7248), was bought; by the end of the week, the large cap index reversed higher to close at 7431, up 0.7 percent for the week.
Earlier on June 2, the S&P 500 peaked at 7621, before losing nearly 400 points, 200 of which have been recouped. If the bulls continue to get their act together, they are likely to have cooperation from the oversold daily technicals.
On the weekly this week, a dragonfly doji formed. This candle signals a potential market reversal. Immediately ahead, short-term horizontal support-turned-resistance lies just north of 7500, and this needs to be won back as soon as possible. Else, a major breakout retest will take place at 7000, or just underneath, at some point.
Euro: Currently net long 13.9k, down 34.9k.
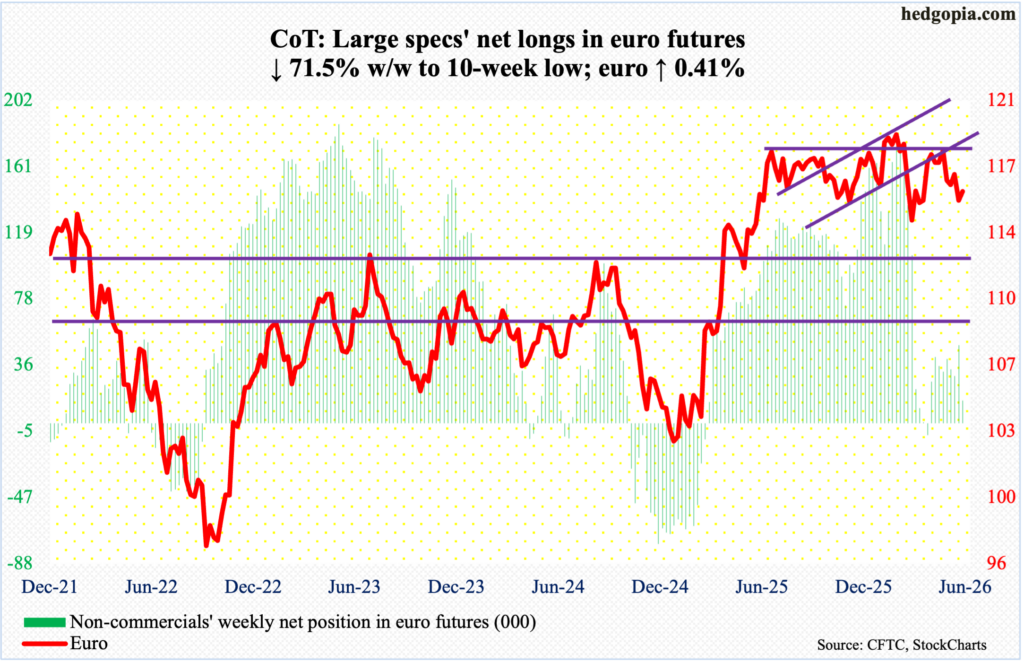
The week began by Monday’s session low $1.150 undercutting last week’s low ($1.151), but euro bears could not keep up the early momentum. When it was all said and done, bulls rallied the currency 0.4 percent for the week to $1.157.
Earlier, after trying for five successive weeks to penetrate horizontal resistance at $1.18, longs gave up five weeks ago. This was preceded by a four-and-a-half-year high $1.2083 posted on January 27. On March 13, the euro bottomed at $1.141.
The 50- and 200-day (respectively $1.167 and $1.168) lie above. After breaching the averages mid-May, bulls’ attempts to reclaim them late May-early June were flatly rejected. Reclaiming the averages can open the door to a test of the upper band of a one-year range of $1.14-$1.18.
Gold: Currently net long 173.8k, down 2.2k.
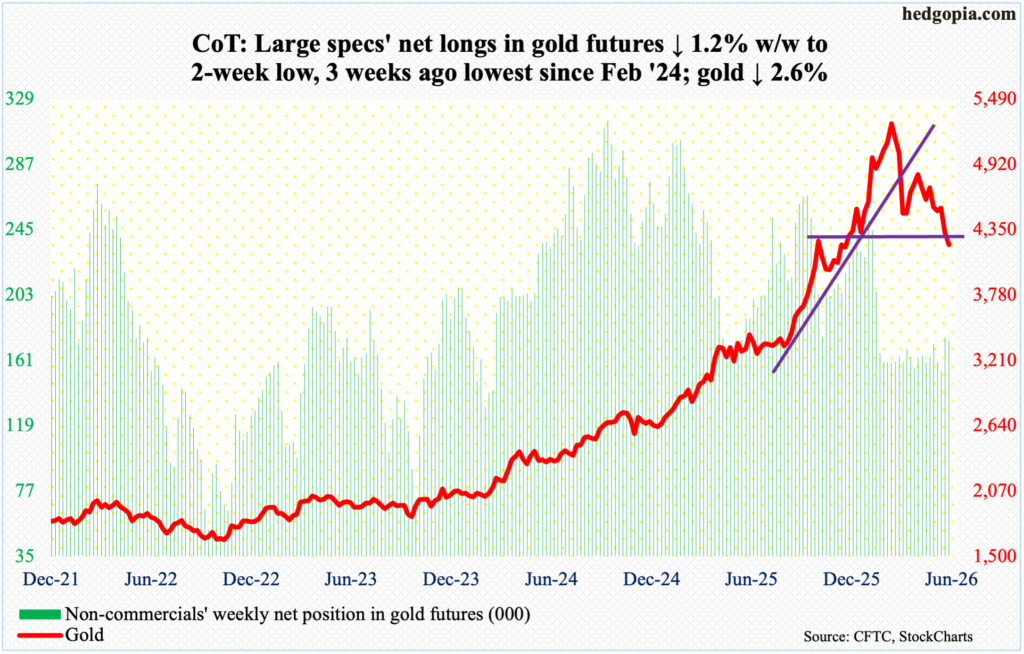
Having breached the 200-day ($4,424) last week, gold continued lower this week, down 2.6 percent to $4,218/ounce. Tuesday’s session high $4,364 also amounts to a rejection at $4,370s, which was compromised last week, albeit not by a whole lot; now, gold is meaningfully below that level.
The yellow metal has been on the defensive ever since peaking at $5,608 on January 29, before proceeding to make a series of lower highs. In October 2023, gold bottomed at $1,810, and at $3,312 last August.
Bears can take solace in the fact that they were able to defend the March 23 low of $4,099; that said, back then, the 200-day was intact, not this time.
Nasdaq (mini): Currently net short 1.3k, down 13.6k.
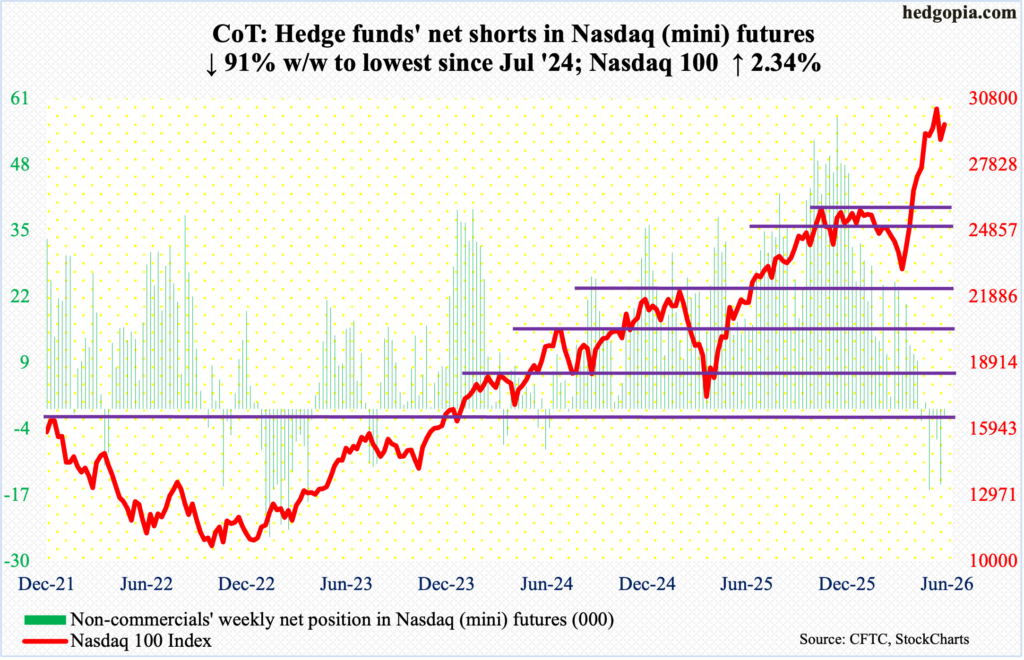
Just like how things evolved in the S&P 500, the tech-heavy Nasdaq 100 underwent a similar rollercoaster ride this week – down sharply by Tuesday’s intraday low 28197 and then up a decent amount in the last two sessions, in the end reversing from down 2.6 percent at Tuesday’s low to close up 2.3 percent for the week to 29636.
Earlier on the 3rd this month, the Nasdaq 100 ticked 30762 intraday and headed lower, losing 8.3 percent by Tuesday’s low. It is a decent decline, but nothing compared to a surge of 34.7 percent from March 30 when the index bottomed at 22841. The latest drop only unwinds a small portion of the overbought condition the Nasdaq 100 is in.
Tuesday’s low occurred just above the 50-day (now 28019). Eventually, a major breakout retest at 26100s is a matter of when not if.
Russell 2000 mini-index: Currently net short 38k, up 23k.
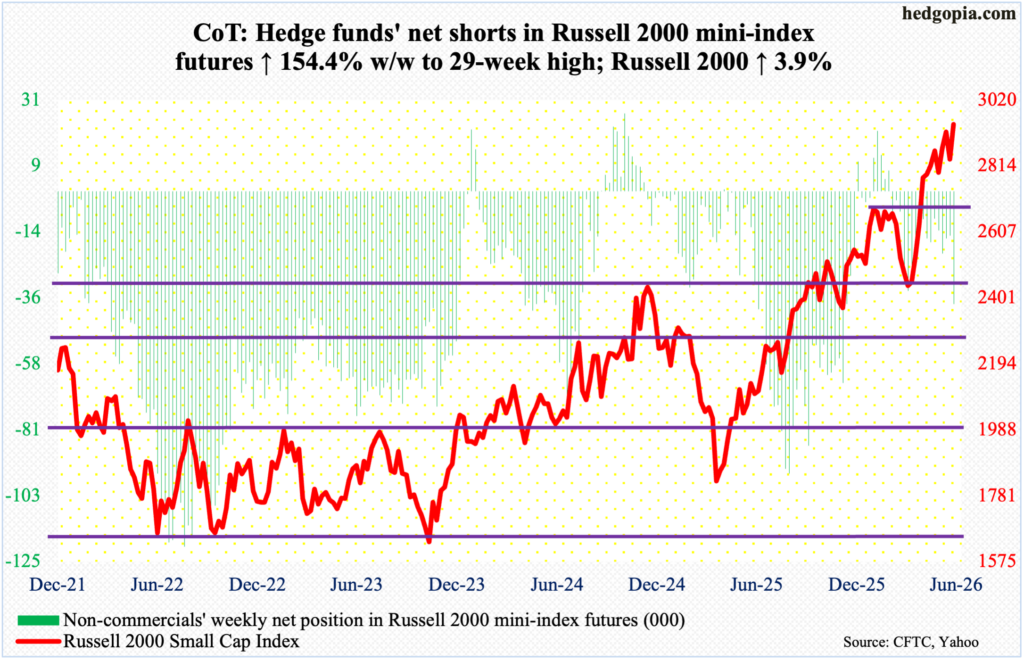
Like its large-cap cousins, the Russell 2000 experienced a very wide range this week, with a high of 2971 on Friday and a low of 2795 on Tuesday. If that low held, the small cap index would have decisively breached 2880s. Concurrently, if Friday’s high held, it would have broken out of 2940s, which were both hit in the prior two weeks; in the end, the index finished up 3.9 percent this week to 2944. This is a new closing high, but at the same time this also means the index is yet to break free of 2940s.
As things stand, bulls probably hold an edge in the very near term.
US Dollar Index: Currently net long 1.4k, down 2.4k.
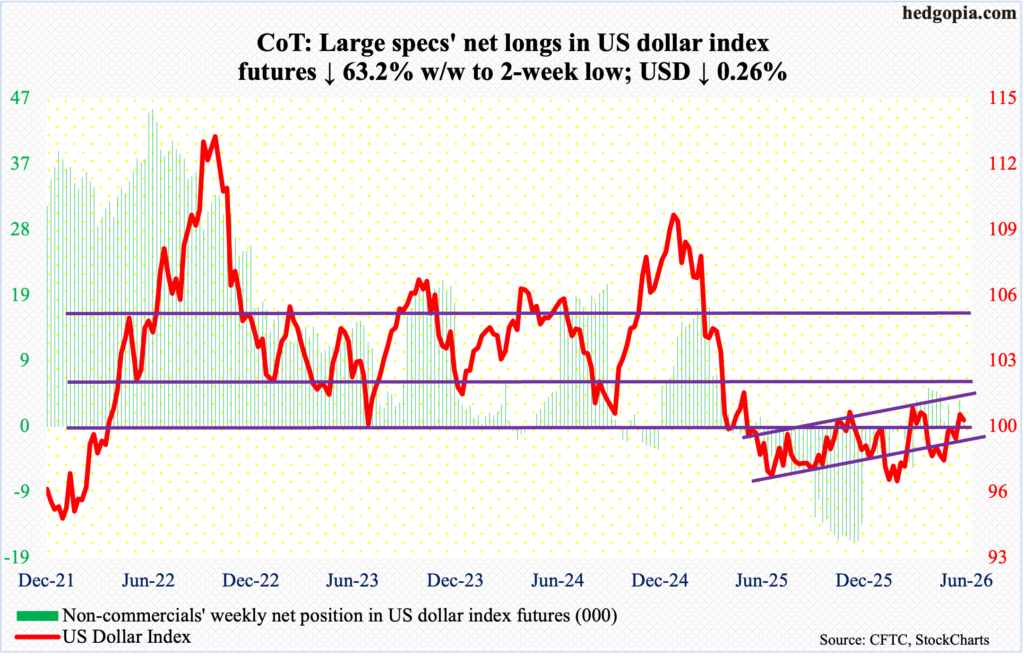
Yet again, dollar bulls met with selling pressure at 100, losing 0.3 percent this week to 99.81.
The significance of 100 goes back more than a decade, and the level was lost in April last year. More recently, after unsuccessfully trying for five weeks to reclaim 100, including March 31 when an intraday high of 100.64 was hit intraday, longs gave up trying 10 weeks ago.
After finding footing just under 98 for several weeks in April and May, bulls went after 100 particularly the last two weeks, with a high of 100.11 last week and 100.31 this Thursday. The denial at 100 suggests the bears have the upper hand right here and now. Once 99.40s give way, the 50- and 200-day lie at 98.88 and 98.67 respectively.
VIX: Currently net short 74.4k, up 4.5k.
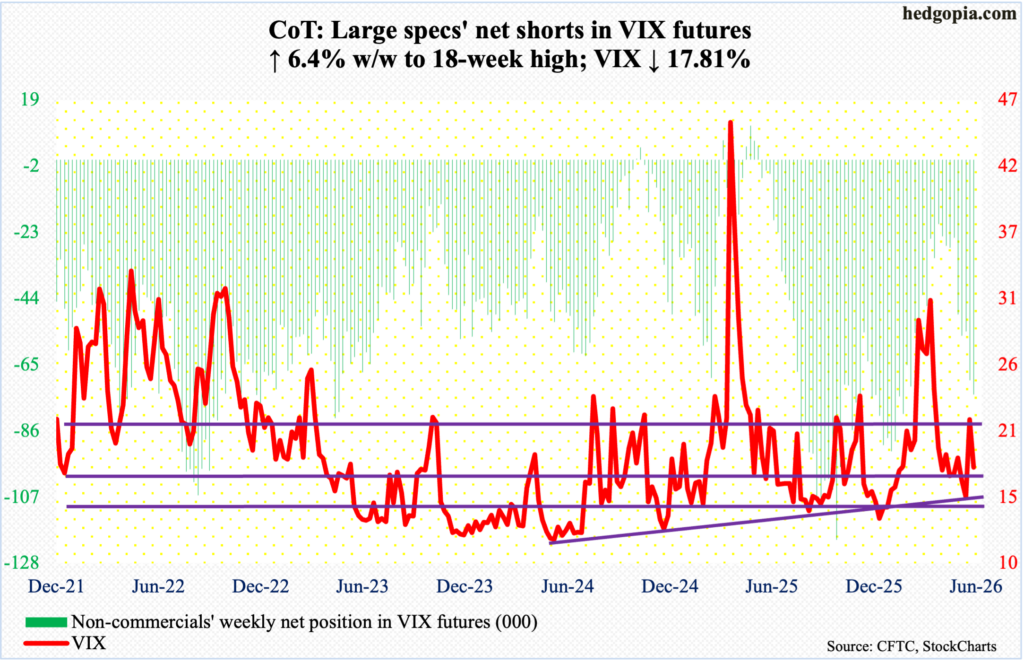
Volatility longs had a great opportunity to build momentum this week but came up short, failing to cling on to Tuesday’s intraday high of 23.34. By Friday, VIX was down 3.83 points for the week to 17.68.
On the weekly, VIX has plenty of room to trend higher, but in the short-term, the overbought daily is likely to win out, putting volatility under pressure. On Friday, VIX sliced through both the 50- and 200-day (respectively 18.40 and 18.52). For whatever it is worth, the averages just completed a death cross.
Thanks for reading!
