
Following futures positions of non-commercials are as of July 28, 2026.
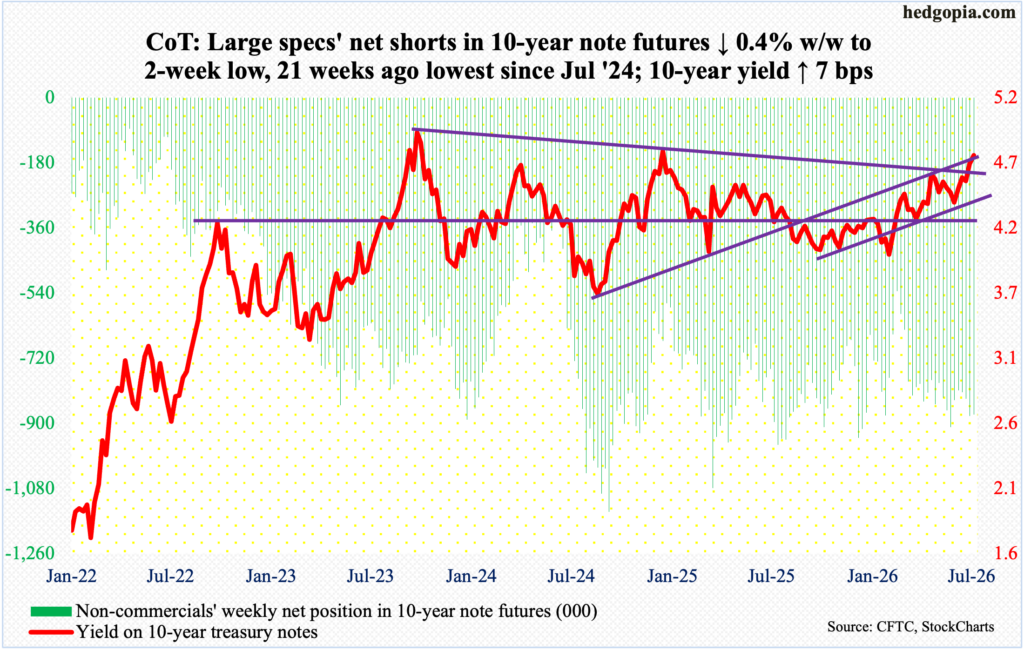
10-year note: Currently net short 876.1k, down 3.6k.
Markets are having a tough time adjusting to a new Federal Reserve chair. As head of the central bank starting May 22, Kevin Warsh chaired his 2nd FOMC meeting this week, with members voting to keep the fed funds rate unchanged at a range of 3.50 percent to 3.75 percent in a 9-3 vote.
The benchmark rates have been left unchanged since last December when they were reduced by 25 basis points; this preceded a cut of similar magnitude in September and October. Earlier, rates reached a cycle high 5.25 percent to 5.50 percent in July 2023, followed by cumulative cuts of 100 basis points over three meetings in 2024.
The decision to keep the rates steady this week was expected, but the three dissents from regional Fed presidents – Beth Hammack (Cleveland), Lorie Logan (Dallas) and Neel Kashkari (Minneapolis) – were probably not. Most interesting was bond vigilantes’ decision to call Warsh’s bluff, as rates rallied on the long end of the yield curve, with the 10-year adding seven basis points this week to 4.75 percent.
During his first FOMC meeting in June, Warsh’s “this committee will deliver price stability” statement seemed to have come from someone determined to break the back of inflation, which has remained above the Fed’s stated goal of two percent for over five years. But during Wednesday’s post-meeting press conference, Warsh refused to even hint at, let alone commit to, a hike come September, even as markets heavily favor one.
Warsh is not for giving forward guidance, which is a break from tradition that began in the Ben Bernanke era post-financial crisis. In and of itself, the new policy may not be all that bad, but spoiled market participants expect hand-holding. The likely tussle between the two entities in the months and years to come can be a boon to volatility-loving traders.
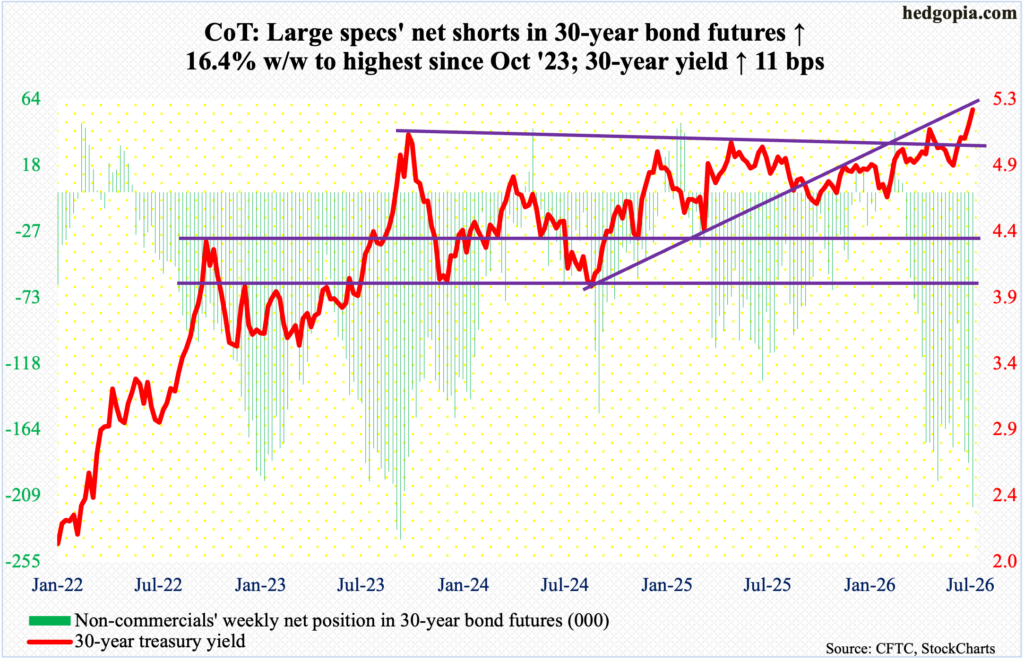
30-year bond: Currently net short 217.5k, up 30.7k.
Major US economic releases for next week are as follows.
The ISM manufacturing PMI (July) is due out Monday. Manufacturing activity in June fell seven-tenths of a percentage point month over month to 53.3 percent. This was the sixth consecutive month of expansion following a 10-month contraction.
Job openings (JOLTs, June) and factory orders (June) are on schedule for Tuesday.
Non-farm openings grew 9,000 m/m in May to 7.59 million, which set a two-year high. Last December’s 6.55 million was a 68-month low.
Preliminarily in June, orders for non-defense capital goods ex-aircraft – proxy for business capital spending plans – rose 0.9 percent m/m to a seasonally adjusted annual rate of record $85.1 billion; from a year ago, orders shot up 12.5 percent.
Wednesday brings the ISM services PMI (July). June services activity shrank five-tenths of a percentage point m/m to 54 percent.
Labor productivity (2Q26) will be published Thursday. Non-farm output per hour grew 2.8 percent annually in the March quarter – a six-quarter high.
Payrolls (July) come out Friday. In June, the economy added 57,000 non-farm jobs, for a six-month average this year of 92,000, which is much better than last year’s dismal monthly average of 10,000.
WTI crude oil: Currently net long 124.1k, up 29.9k.
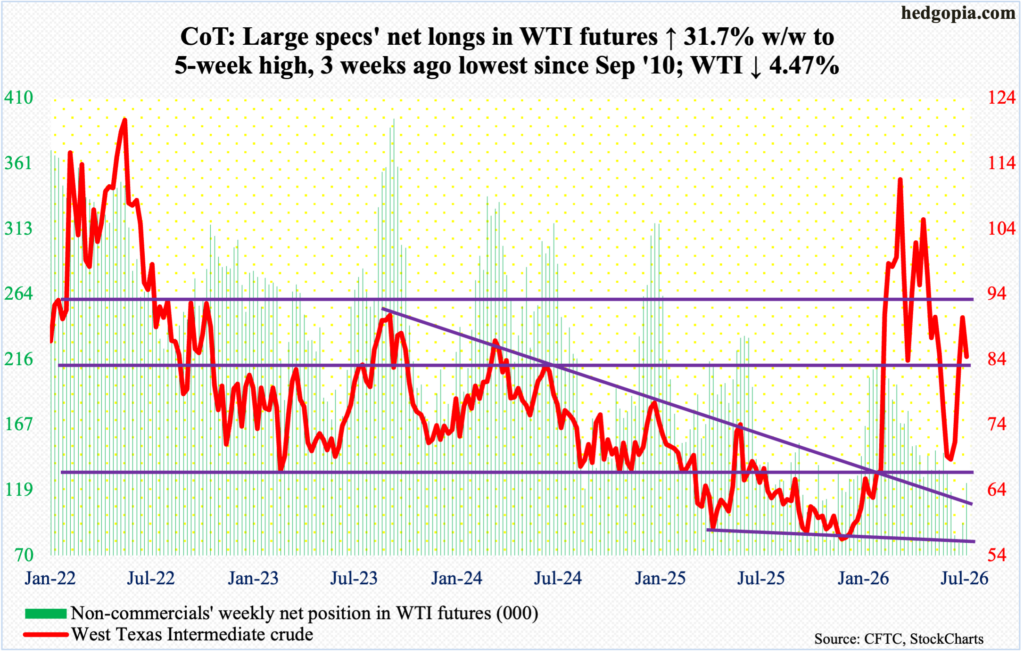
With a high of $86.45 (Friday) and a low of $77.78 (Tuesday), West Texas Intermediate crude had a rollercoaster of a week, in the end finishing down 4.5 percent to $86.42/barrel. This preceded three up weeks in a row, after the crude bottomed at $67.04 on July 2, which filled a gap from March 2 when it gapped up in response to the February 28 launch of a military attack by the U.S. and Israel on Iran. On February 27, WTI closed at $67.02, with a session high of $67.83 and a low of $64.85.
Last week, the crude retreated after tagging $93.50, facing trendline resistance from March 9 when it tagged a four-year high $119.48. This week, the 50-day moving average was breached on Monday but recouped on Wednesday. Odds favor strength in the sessions ahead. The trendline resistance in question will be tested around $92.
In the meantime, as per the EIA, US crude production in the week to July 24 declined 2,000 barrels per day week over week to 13.796 million b/d; in the week to July 10, production of 13.861 mb/d was only 1,000 short of the record 13.862 mb/d posted in the week to November 7 last year. Crude imports dropped 123,000 b/d to 5.68 mb/d. As did crude inventory which decreased 7.2 million barrels to 404.5 million barrels; stocks of gasoline and distillates respectively were up 7,000 barrels and 1.1 million barrels to 211.3 million barrels and 110.6 million barrels. Refinery utilization rose 1.1 percentage points to 97.2 percent.
E-mini S&P 500: Currently net short 17.2k, up 412.
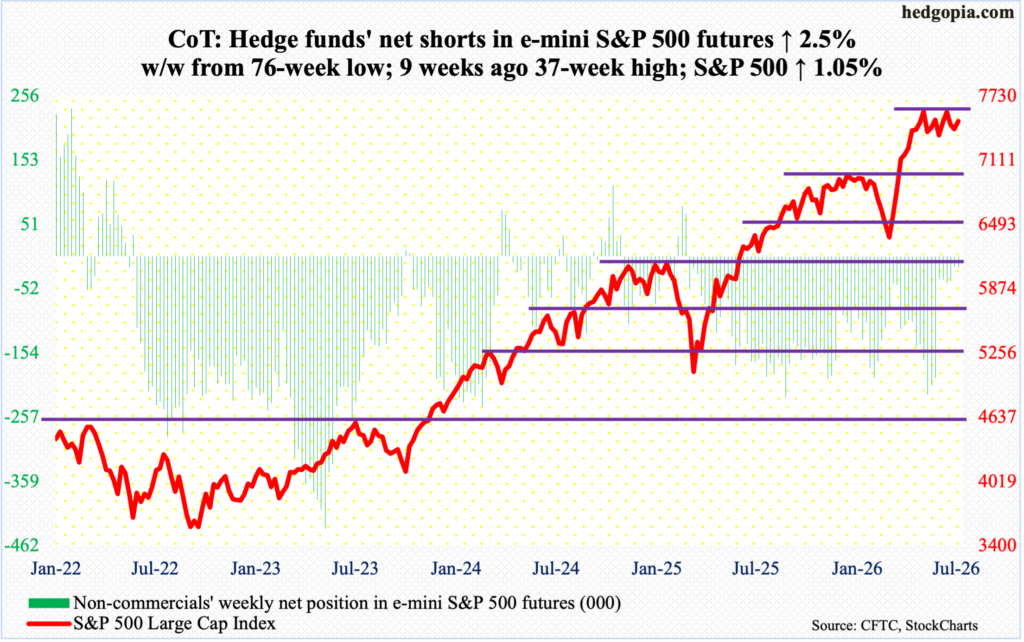
After two consecutive down weeks, equity bears continued to press their case initially. At Wednesday’s low, the S&P 500 was down 1.3 percent. Bulls then responded to Big Tech results in the next two sessions, rallying the large cap index hard to end the week up 1.1 percent to 7490.
After remaining under the 50-day for six successive sessions, the index reclaimed the average on Friday, although the session high 7512 drew sellers where it could possibly have.
Last week, the S&P 500 fell out of a pennant going back to June 2 when it peaked at 7621; this week, Friday’s high kissed the lower-line resistance of the broken pattern. Should bulls continue to ride the momentum of Thursday and Friday next week, the upper-line resistance lies at 7550.
Euro: Currently net short 72.4k, up 31.1k.
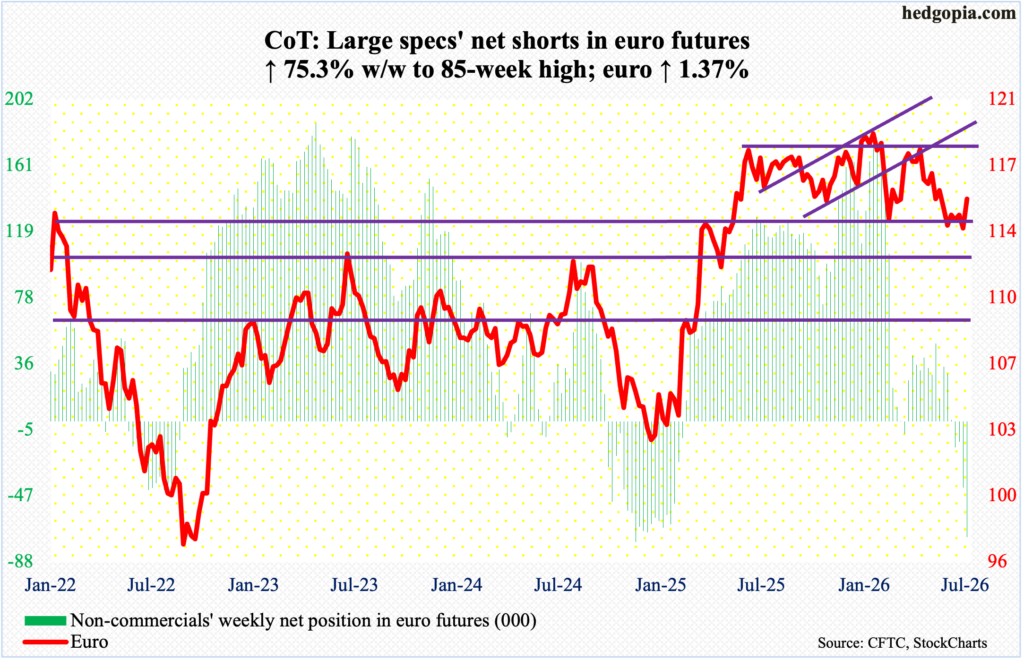
Non-commercials continued to add to net shorts, with holdings now the highest since December 2024; until a month ago, they were net long. The cash, however, is not cooperating with these traders.
This week, the euro gained 1.4 percent to $1.152. Bulls finally succeeded in pushing the currency past $1.147s, which stood like a rock for five consecutive weeks. This also means a successful defense of one-plus-year range support.
For more than a year, the euro went back and forth between $1.14 and $1.18. Along the way, it tagged a four-and-a-half-year high $1.208 on January 27, then dropping to $1.141 by March 13; that low was breached on June 23, with $1.132 tagged in the next session. Rally attempts that followed were consistently denied at $1.147s – no more.
Immediately ahead, there is horizontal resistance at $1.157s, followed by the 200-day at $1.163.
Gold: Currently net long 182.1k, down 1.8k.
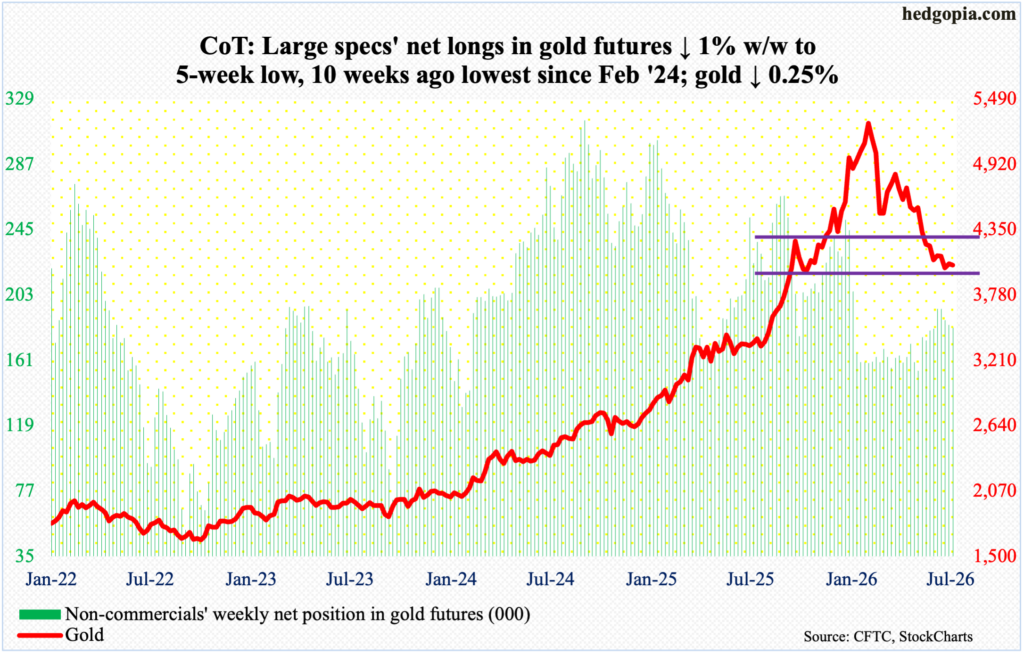
Gold continues to go sideways just above horizontal support at $3,900. For six consecutive weeks now, the metal made weekly lows between $3,900 and $4,000, with this week’s low of $3,996 tagged on Wednesday. For the week, gold dropped 0.25 percent to $4,042/ounce.
The current consolidation follows a bearish trend that began on January 29 when gold peaked at $5,608. Prior to this, it bottomed at $1,810 in October 2023, and at $3,312 last August. Long-term gold bugs hence are still sitting on handsome gains, but the risks they face is the prevailing sideways move breaking to the downside the longer this goes on.
In the event the yellow metal breaks down, the next decent support is not until $3,430s.
Nasdaq (mini): Currently net long 4.9k, up 368.
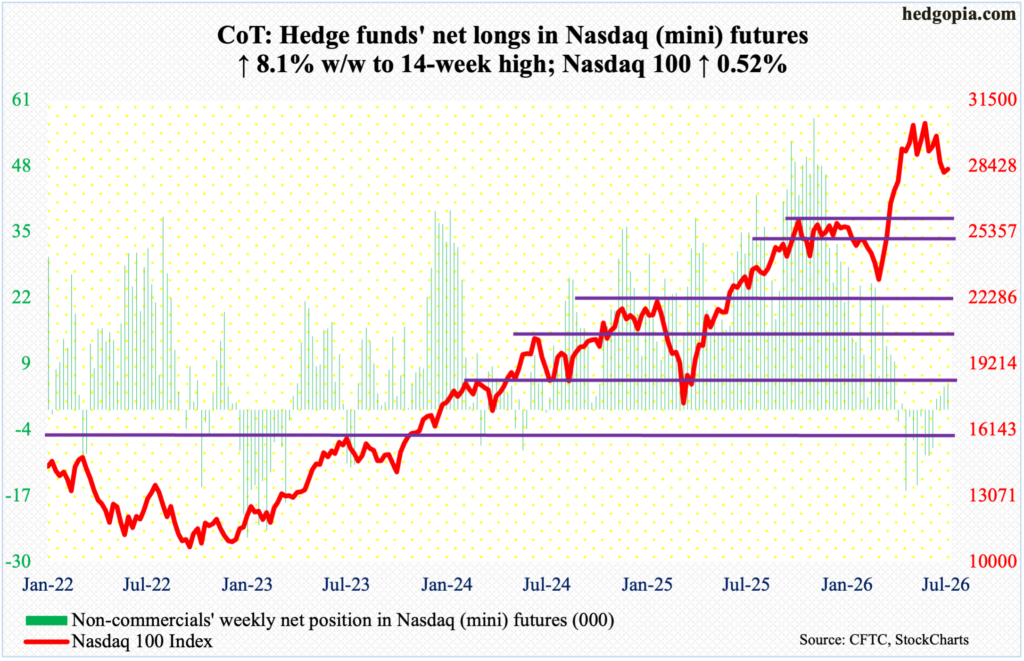
Last week, after Google parent Alphabet’s (GOOG) better-than-expected June-quarter results drew adverse reaction in the markets on concerns of continuously rising capital spending, results from Microsoft (MSFT), Facebook parent Meta Platforms (META), Apple (AAPL) and Amazon (AMZN) this week were waited with bated breath. Shares of both MSFT and AMZN were bid up meaningfully as capex concerns were overridden by signs of sustained AI demand, even as META was punished; AAPL, having just hit a new high on Wednesday, was sold off as well.
When it was all said and done, the Nasdaq 100, down 11.7 percent intraday from the June 3 peak of 30762 through Wednesday’s low 27176, managed to rise 0.6 percent to 28274. Wednesday’s low came well before the 200-day at 26509; at some point, the average will be tested.
Ahead, should tech bulls succeed in retaking horizontal resistance at 28500s, the 50-day at 29390 should pose stiff resistance.
Russell 2000 mini-index: Currently net short 16.3k, up 9.3k.
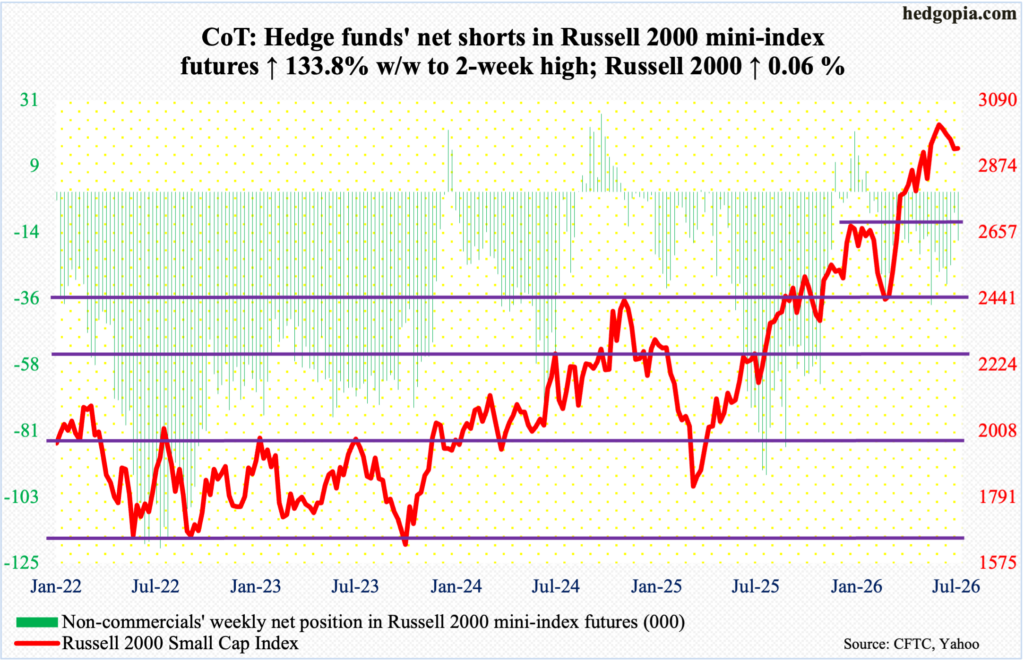
The pattern of lower highs intact since the Russell 2000 peaked at 3047 on July 1 is yet to break. This week’s high of 2972 was posted on Monday. For the week, the small cap index inched up 0.06 percent to 2932.
More importantly for the bulls is the fact that they defended horizontal support at 2880s, with Friday’s low 2897 bought. That said, it is unlikely bids will continue to show up here. Lateral support at 2940s has been breached, albeit ever so slightly, and the 50-day (2944) has been compromised, again not by a whole lot. But the daily RSI (47) is getting resisted at the median. Risks are to the downside.
US Dollar Index: Currently net long 17.2k, up 1.6k.
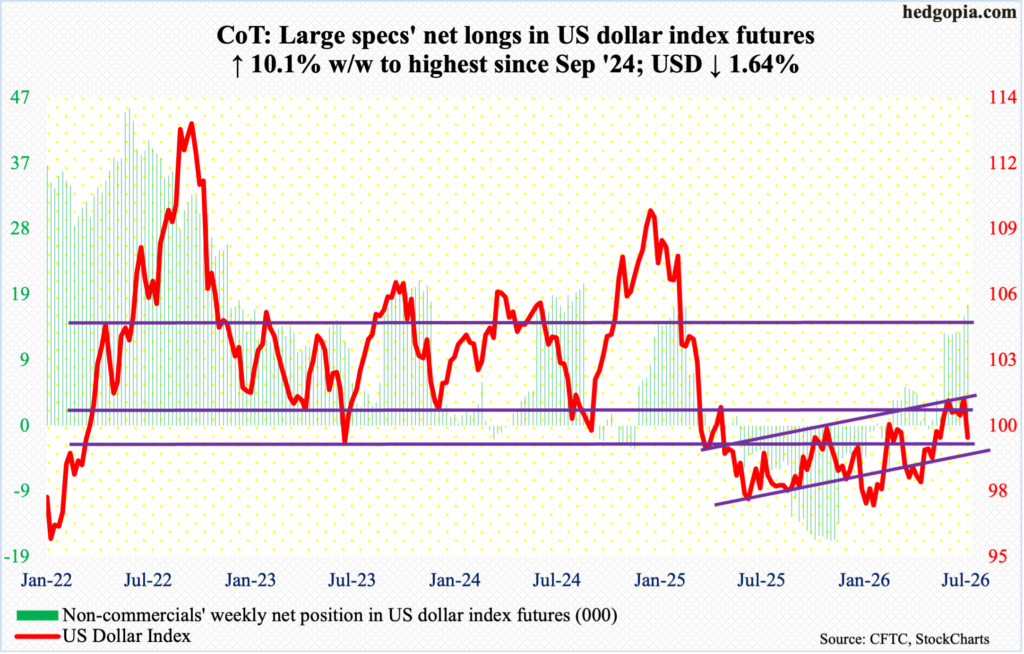
The US dollar index essentially broke down this week, unable to respond to strongly rallying long-term rates. It gave back 1.6 percent to 99.80, down in all but one session. For the first time since mid-May, the 50-day (100.50) has been breached; it is just a matter of time before the 200-day at 99.16 gets tested.
This week’s action follows dollar bulls’ continuous struggle to get past 101-102 for six weeks in a row; this week’s high 101.64 was posted on Tuesday.
Earlier, in January last year, after a three-plus-month rally, the US dollar index reversed hard at 110.18, subsequently reaching 96.38 in June and successfully testing that low with a lower low 96.22 in September. On 27 January, another lower low 95.55 was ticked, and that was embraced by the bulls, ending the week with a weekly dragonfly doji. The rally that followed has run its course. At 99.50 lies trendline support from the January low, and it is a must-hold for the bulls.
VIX: Currently net short 63.4k, down 13.4k.
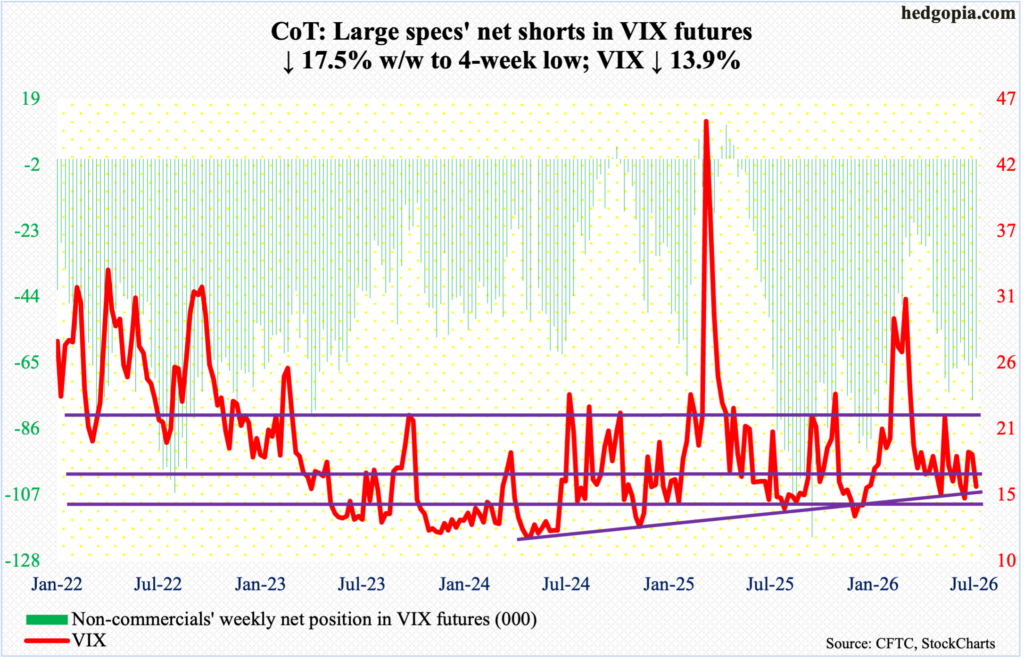
Volatility bulls have had their chances but were unable to capitalize on those. On Wednesday, VIX ticked 20.88 intraday, but only to then reverse hard lower in the next couple of sessions to end the week down 2.59 points to 15.99.
On the weekly, VIX has tons of room to rally, but positive momentum is coming up short, with the weekly RSI (46) persistently failing to push past the median.
In the sessions ahead, odds favor the volatility index gravitates toward the low-15s.
Thanks for reading!
