
As rates are expected to be left unchanged in this week’s FOMC meeting, inflation expectations for next year have firmed up a tad. Rates on the long end of the curve are near crucial support after reaching multi-year highs, even as the major equity indices are attempting to rally after dropping to crucial support.
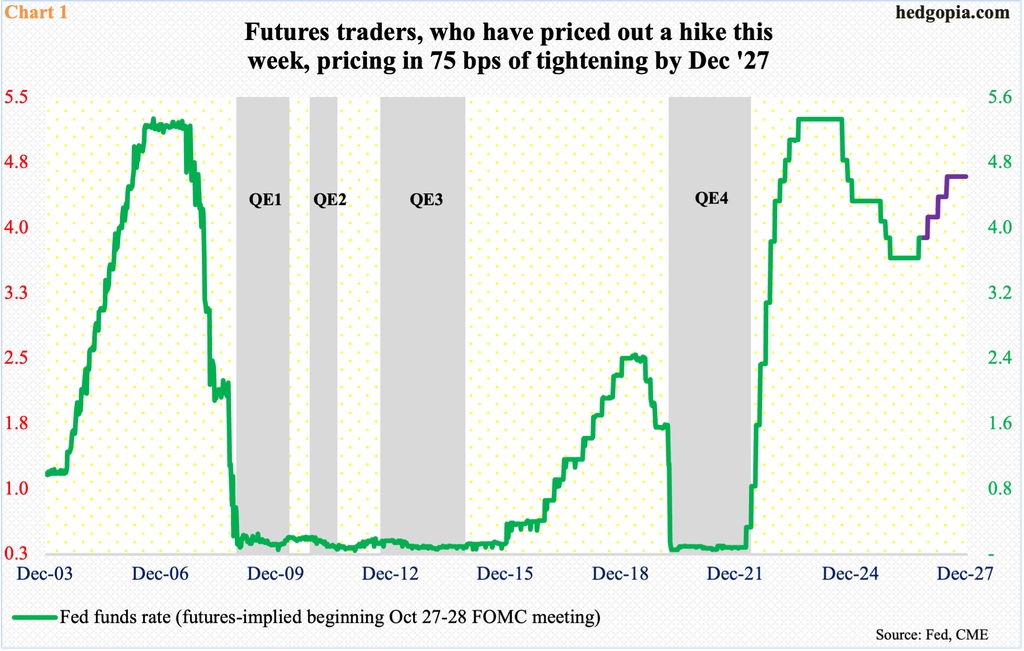
A two-day FOMC (Federal Open Market Committee) meeting begins today. Until just a few weeks ago, markets were bracing for a 25-basis-point increase, which would have been the second consecutive hike. The policy-making body unanimously raised the fed funds rate by 25 basis points to a range of 375 basis points to 400 basis points in the September meeting. This was the first hike since July 2023.
Now, the benchmark rates are expected to be left unchanged. Come December, however, a quarter-point hike is priced in as shown by the CME FedWatch tool, and this would be followed by two more next year, ending 2027 between 450 basis points and 475 basis points (Chart 1). If this expected tightening comes to pass, the Federal Reserve would have rolled back 100 basis points of the 175 basis points of easing in the preceding cycle.
Chair Kevin Warsh, who took over in May, has time and again expressed displeasure at the elevated consumer inflation. He has a point. In the 12 months to September, headline and core CPI (consumer price index) grew 3.7 percent and 2.6 percent respectively. September’s PCE (personal consumption expenditures) is due out this Thursday, and the headline and core in August were up 3.4 percent and three percent respectively from a year ago. The Fed targets two percent on core inflation.
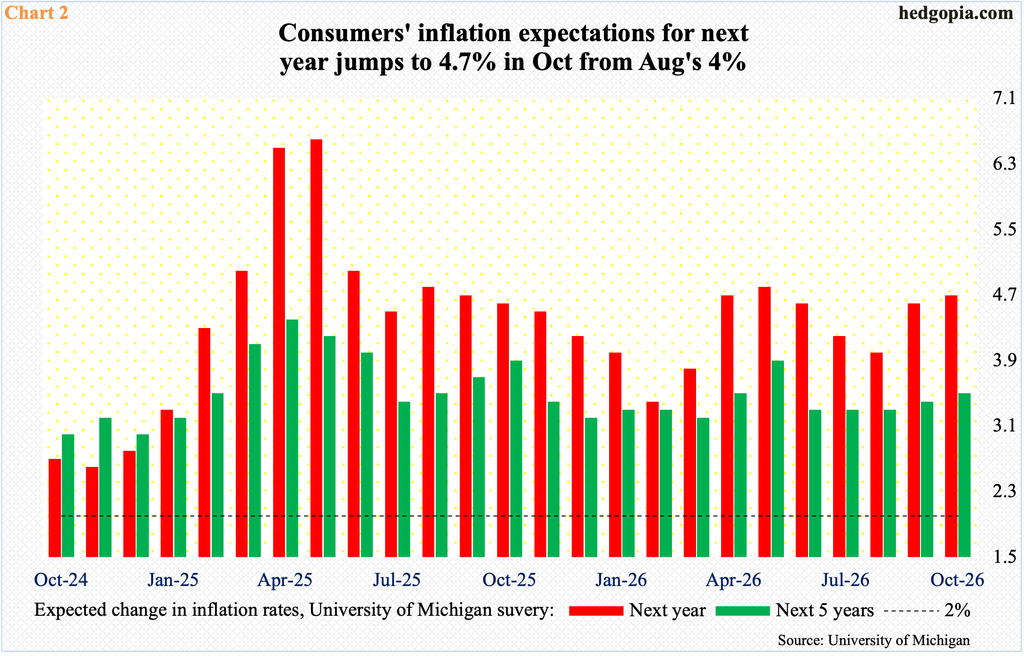
As inflation refuses to progress toward the central bank’s goal, inflation expectations in the meantime have been vacillating in recent months, with a slight upward bias.
The University of Michigan’s survey for this month showed that the expected change in inflation rates for next year inched up one-tenth of a percentage point month over month to 4.7 percent, and as recently as August the metric was at four percent (Chart 2).
Inflation persisted higher, but rates on the short end were being held steady for three long years, although the long end of the treasury yield curve was not cooperating.
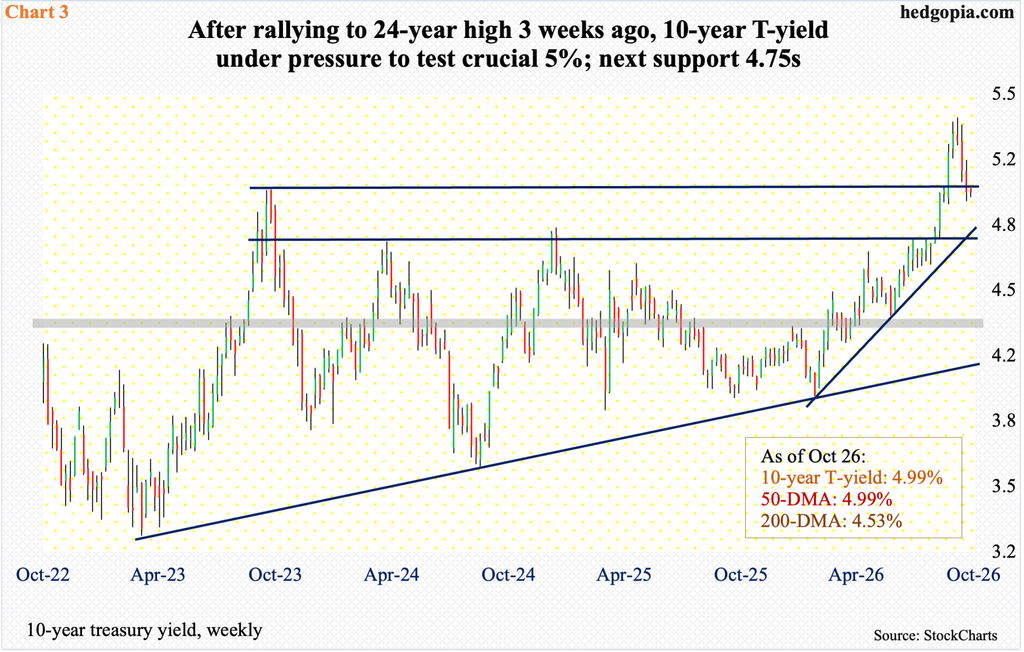
The 10-year T-yield jumped from 3.96 percent in February to 5.36 percent on the 7th this month, with the latter the highest since April 2002. Since that high, the 10-year has come under pressure for three consecutive weeks, with Monday (this week) just about flat at 4.99 percent – right at the 50-day moving verge.
There is crucial support at five percent (Chart 3). Prior to the recent downturn, the 10-year remained extended for a while. If the weekly continues to unwind the overbought condition it is in and the 10-year continues lower, bond bears (on price; price and yield are inversely related), who benefit if rates rally, are likely to step up to the plate to defend 4.75s.
Small-caps likely will react to this. Small-cap businesses inherently have more exposure to the domestic economy versus their mid- and large-cap brethren which are also exposed internationally. Small-caps also tend to be leveraged, with more exposure to the short end.
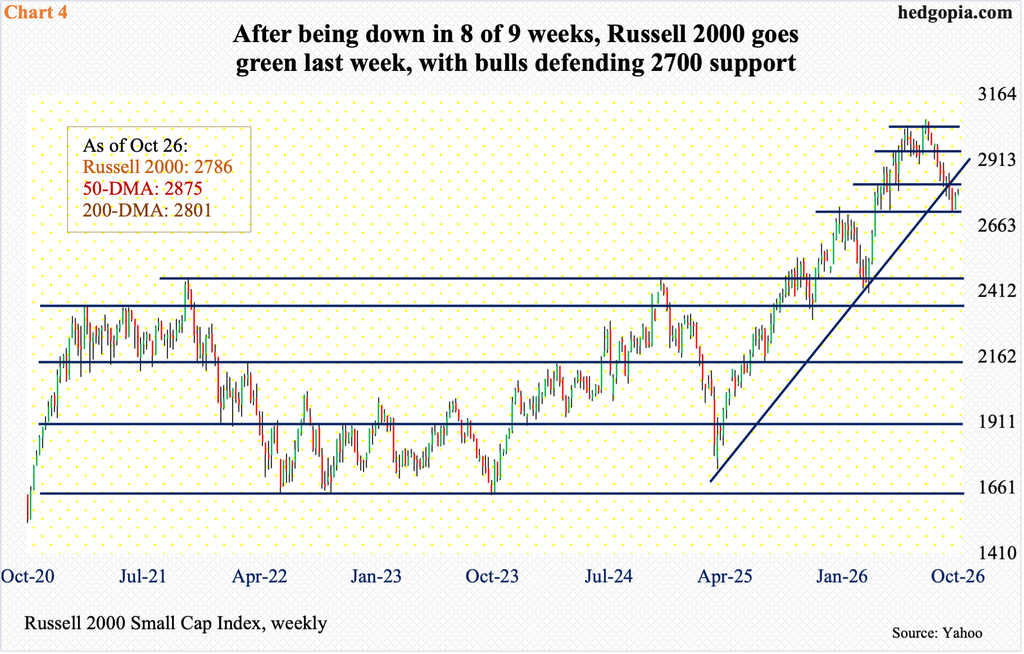
The Russell 2000 (2786) peaked at 3070 on August 14 and proceeded to drop eight of nine weeks before going green last week. Small-cap bulls showed up just north of horizontal support at 2700 (Chart 4). The index has closed under the 200-day for nine sessions in a row. A takeout of this average opens the door toward support-turned resistance at 2840s.
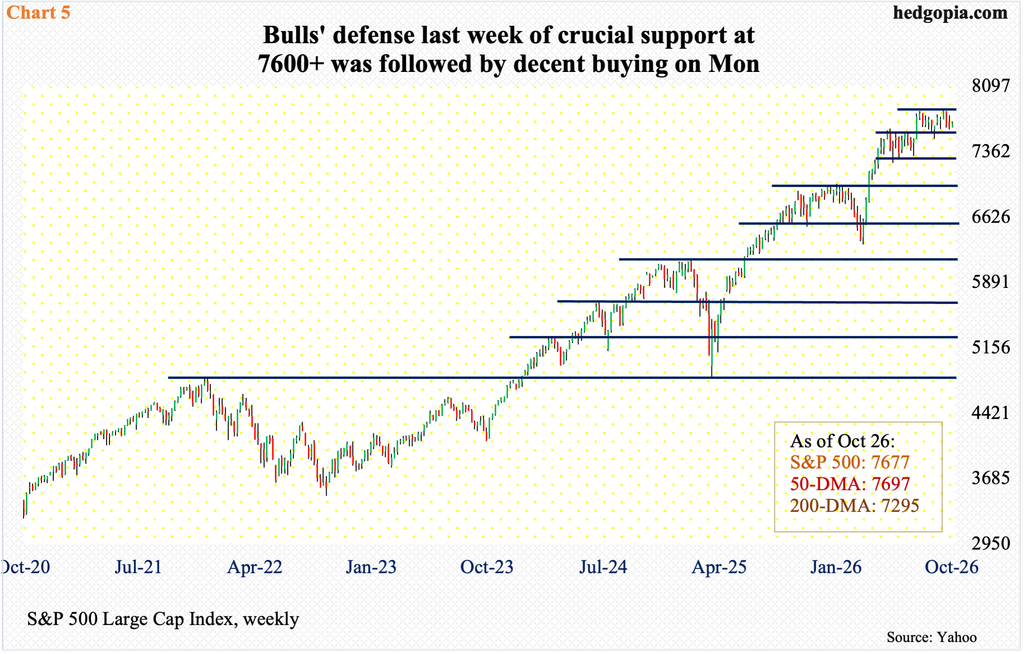
Large-cap bulls too showed up last week in defense of crucial support on the S&P 500, which earlier consolidated for a couple of months after peaking at 7621 on June 2, with a breakout on August 4, followed by the August 13 high 7817 and a newer high 7845 posted on the 6th this month.
Last Thursday, the S&P 500 (7677) ticked 7612 and generated some buying interest (Chart 5). Monday, the index added 0.7 percent, although Friday’s session high 7702 – just above the 50-day (7697) – could not be held on to. The average is the hurdle for now.
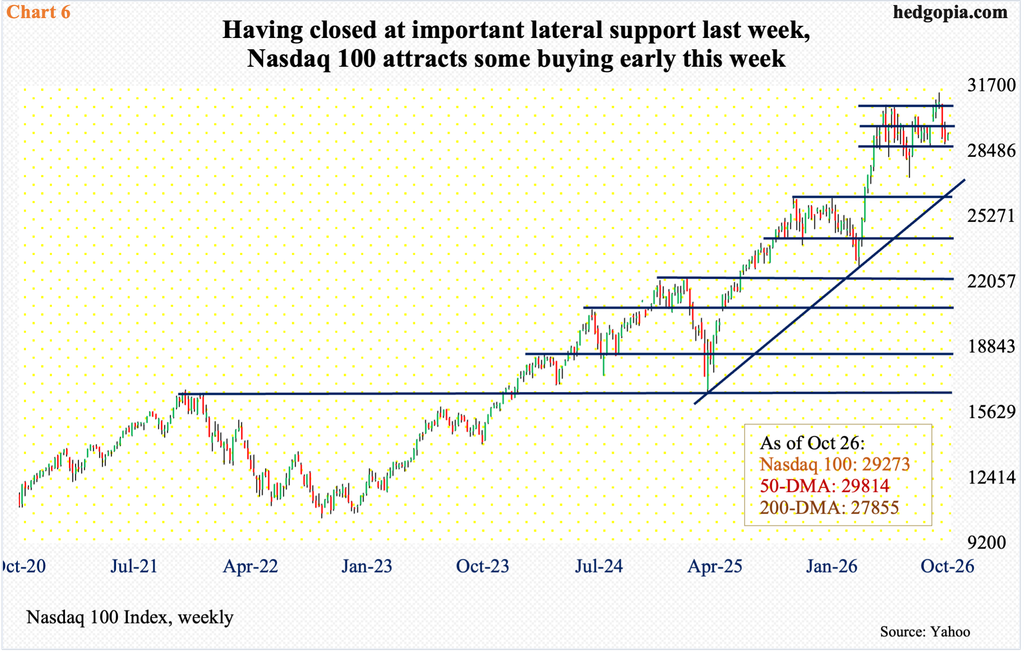
The Nasdaq 100 was no exception in terms of finishing last week right at important support, closing at 28958, with a low of 28826. There is important horizontal support at 28800s, and it was defended (Chart 6).
On Monday, the tech-heavy index rallied 1.1 percent to 29273, but it remains under the 50-day (29814).
From the March 30 low of 22841 to the fresh all-time high of 31361 on the 6th this month, the Nasdaq 100 jumped 37.3 percent; going back further, it surged 89.6 percent from the April 2025 low of 16542.2. Not surprisingly, on multiple timeframes, the index remains overbought. At this stage, an unwinding of these conditions is quite possible. A breach of 28800s probably results in a test of the 200-day (27855) in a hurried manner.
Thanks for reading!
