
Following futures positions of non-commercials are as of October 27, 2026.
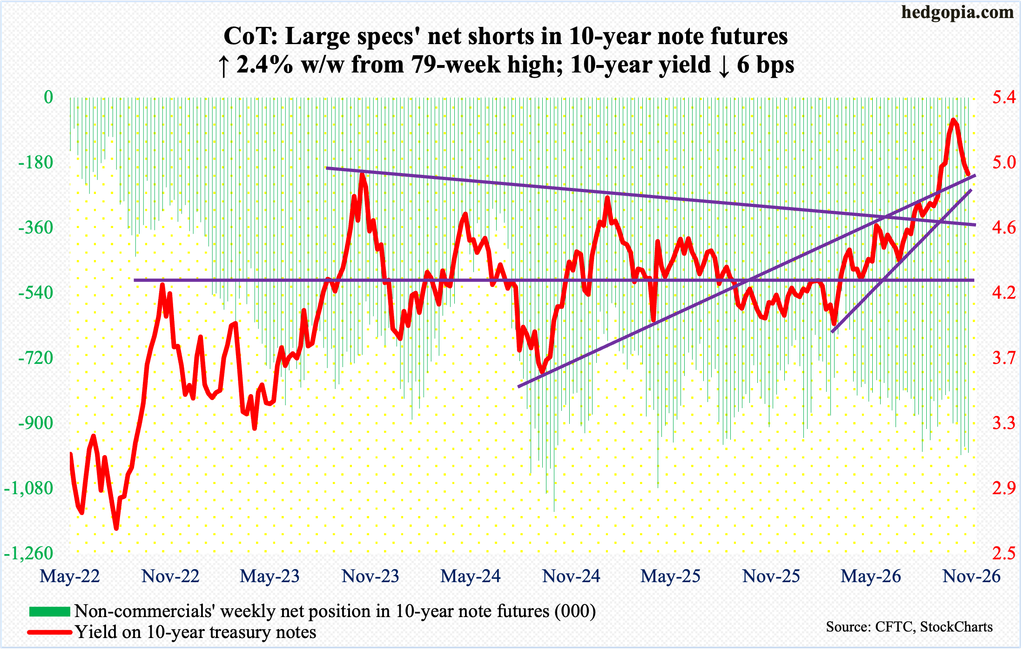
10-year note: Currently net short 981.5k, up 17.2k.
The FOMC (Federal Open Market Committee) this week delivered what can be described as a hawkish hold, leaving the fed funds rate unchanged at a range of 3.75 percent to four percent but warning about persistently elevated inflation. It was a 10-2 vote. The benchmark rate was raised by 25 basis points in the September meeting, which was the first hike since July 2023.
On Thursday, a day after the FOMC meeting, September’s PCE (personal consumption expenditures) was reported, and it came in strong, with the headline and core rising 3.65 percent and 3.12 percent from a year ago respectively. May’s 3.82 percent and 3.16 percent were the steepest year-over-over rise in 36 months and 31 months, in that order. The Federal Reserve targets two percent on the core.
Bond bears (on price; price and yield are inversely related to each other), betting on higher rates, rallied the 10-year treasury yield on Wednesday, the day the FOMC decision was made public, but they ran out of steam by Friday; for the week, the yield dropped six basis points to 4.93 percent.
The 10-year has been under pressure since tagging 5.36 percent on October 7; this was the highest print since April 2002. The yield rallied incessantly from 3.96 percent in February, and it thus remains overbought on several timeframes.
As bond bears are struggling to defend five percent, which also lines up with the 50-day moving average, the next level to watch is 4.75s, which likely holds. By then, markets would be getting ready to an expected hike in the fed funds rate in the December meeting.
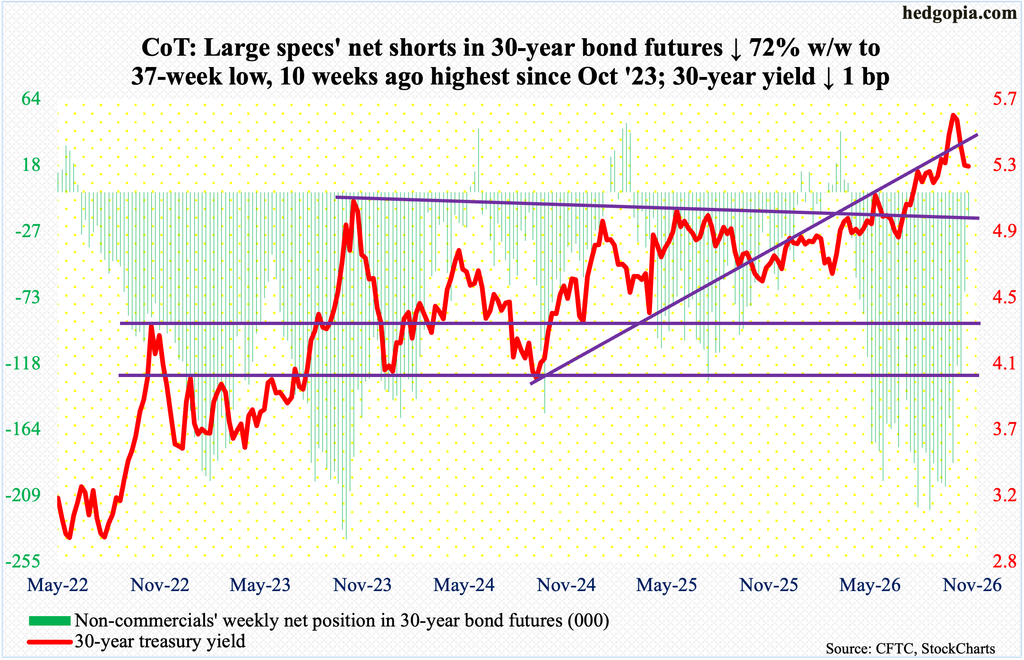
30-year bond: Currently net short 19.1k, down 49.3k.
Major U.S. economic releases for next week are as follows.
The ISM manufacturing PMI (October) is due out Monday. Manufacturing activity in September edged lower one-tenth of a percentage point month over month to 54.5 percent. This was the ninth consecutive month of 50-plus readings, coming on the heels of a 10-month contraction.
Tuesday brings job openings (JOLTs, September) and durable goods orders (September, final).
Non-farm job openings in August tumbled 256,000 m/m to 7.1 million. Last December’s 6.6 million was the lowest since September 2020.
Preliminarily, new orders for non-defense capital goods ex-aircraft – proxy for business capital spending plans – grew 0.5 percent m/m in September to a seasonally adjusted annual rate of $88 billion, which is a fresh record. Orders jumped 13.5 percent from a year ago, just a touch under August’s 14.1 percent, which was the steepest year-over-year growth rate in five years.
The ISM services PMI (October) is scheduled for Wednesday. September non-manufacturing activity slid five-tenths of a percentage point m/m to 54.9 percent.
Labor productivity (3Q26, preliminary) will be published Thursday. Non-farm output per hour increased 2.2 percent in the June quarter from a corresponding period last year – a four-quarter low.
Payroll (October) and University of Michigan’s consumer sentiment index (November) are on schedule for Friday.
In September, non-farm jobs only grew 29,000, versus August’s 133,000. This reduced the monthly average this year to 68,000, which is still better than the 2025 monthly average of 10,000.
Consumer sentiment edged down one-tenth of a point m/m in October to 48. May’s 44.8 set a record low.
WTI crude oil: Currently net long 47.1k, down 18.2k.
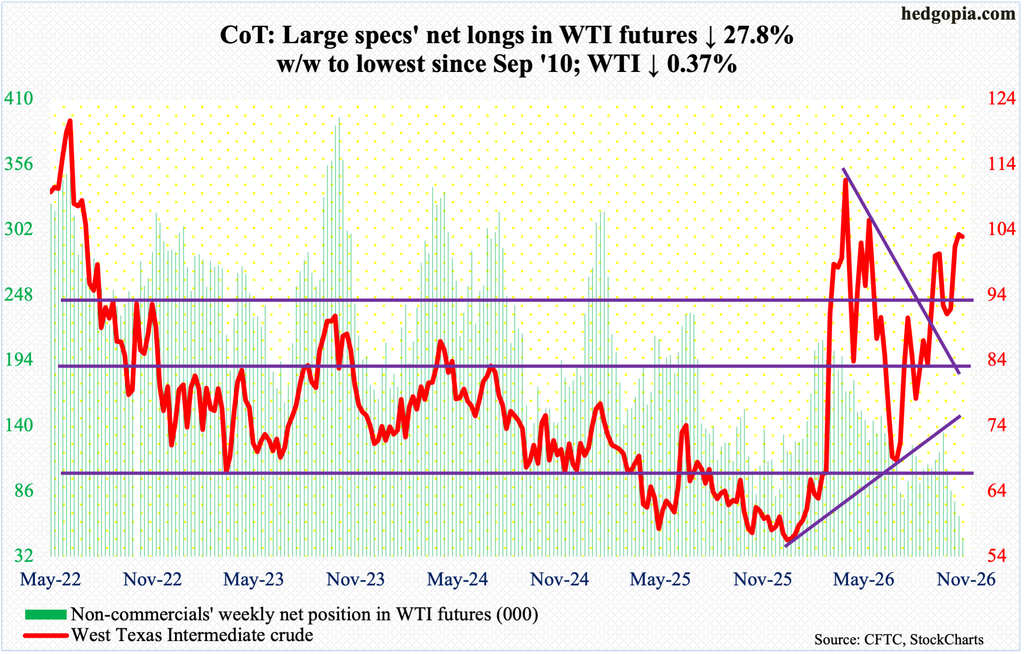
Having rallied West Texas Intermediate crude for three weeks in a row, oil bulls were on course for a fourth until Friday afternoon, but only for the crude to reverse and close the spinning top week down 0.4 percent to $102.89/barrel. At Friday’s gravestone doji session high, it tagged $104.99; a long-legged doji showed up on Thursday.
WTI has come a long way from July 2 when it bottomed at $67.04, filling a gap from March 2 when it enjoyed a six-session surge in the wake of the February 28 U.S. and Israeli military attack on Iran; it subsequently peaked on the 9th at $119.48. On February 27, the crude closed at $67.02, with a session high of $67.83 and a low of $64.85.
After the July trough, WTI rallied all the way to $106.75 by September 15. This price point – or thereabouts – is now being used as a pretext to lock in gains. Friday’s high represents yet another lower high from the March high.
Trendline support (using intraday prices) from the July bottom lies at $94, which also approximates the 50-day at $94.27.
In the meantime, as per the EIA, U.S. crude production in the week to October 23 jumped 723,000 barrels per day week over week to 13.992 million b/d – a record. Crude imports, too, spiked 616,000 b/d to 6.4 mb/d. As did gasoline stocks, which increased 3.9 million barrels to 209.2 million barrels; crude and distillates inventory went the other way, down 1.9 million barrels and 1.5 million barrels respectively to 410.6 million barrels and 102.8 million barrels. Refinery utilization dropped six-tenths of a percentage point to 92.8 percent.
E-mini S&P 500: Currently net short 134.4k, down 8.3k.
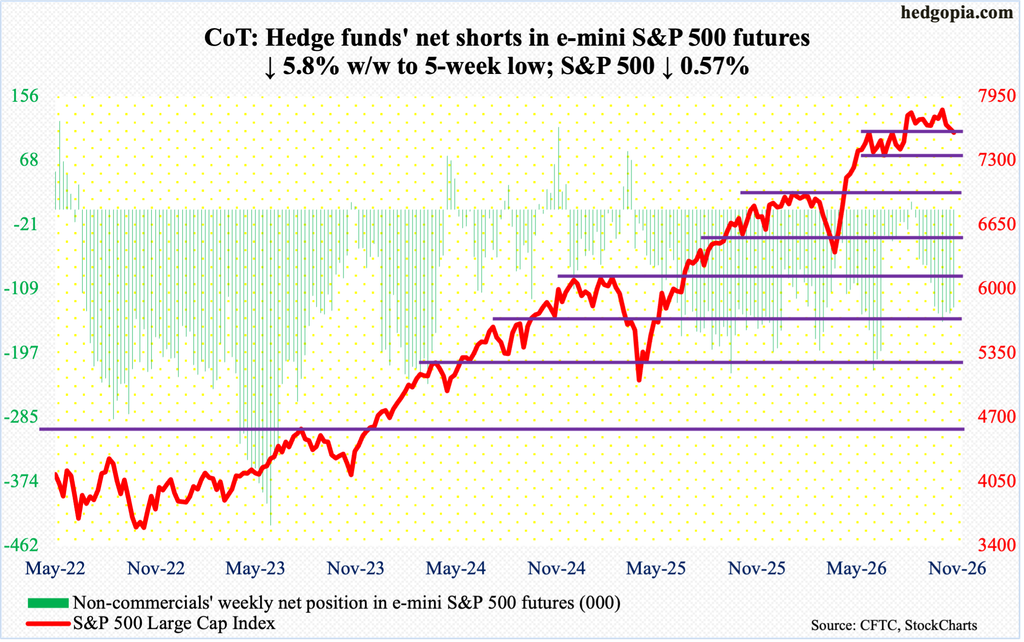
Equity bulls this week dominated in the first three sessions, bears in the last two. Until Wednesday’s session high 7758, the S&P 500 was up 1.8 percent for the week. By the end of the week, all these gains were wiped out, with the week ending down 0.6 percent to 7580.
If the bulls deserve some consolation, it is that Friday’s session low 7528 was bought. But the fact remains that the breach of 7600-plus, not to mention the 50-day at 7697, has now swung the odds in bears’ favor.
Earlier, the index consolidated for a couple of months after peaking at 7621 on June 2, with a breakout on August 4, followed by the August 13 high of 7817 and a newer high last month. The two-and-a-half-month, 200-point range with resistance north of 4800 and support north of 4600 has now broken to the downside.
Once Friday’s low gets taken out, the bears will be eyeing lateral support at 7300s, with the 200-day at 7310.
Euro: Currently net short 143.9k, up 9.4k.
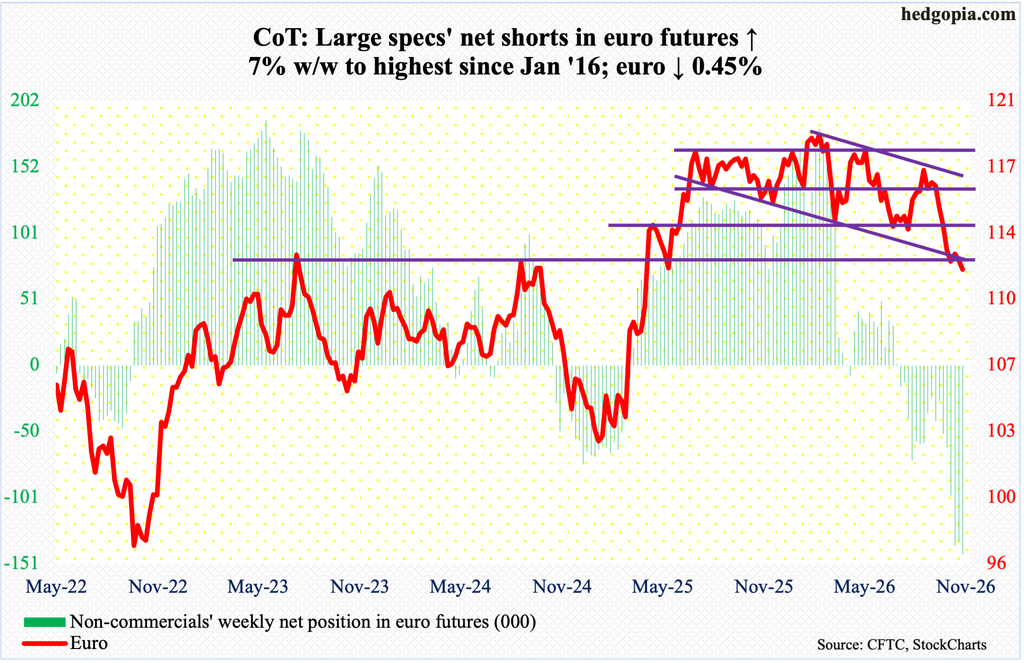
The 21-nation euro-zone economy decelerated to 0.4-percent growth in the September quarter from the June quarter’s 0.6 percent but performed better than stagnation in the March quarter. As expected, the European Central Bank on Thursday voted to hold interest rates steady, but odds remain decent that they would opt for a hike in December.
The euro this week continued to go sideways just above $1.11, with Thursday’s session low $1.1105 embraced by the bulls to finish the week at $1.1155, down 0.45 percent for the week.
The currency is near/just under dual support at $1.12 – horizontal plus descending channel – and has been under downward pressure since peaking on January 27 this year at a four-and-a-year high $1.208. Four weeks ago, it broke crucial range support at $1.14. For more than a year, it vacillated between $1.14 and $1.18.
On particularly the weekly, the currency remains way oversold, and unwinding of these conditions looks probable – more so if non-commercials, whose holdings of net shorts are the highest since January 2016, decide to lock in gains.
Gold: Currently net long 186.5k, down 13.4k.
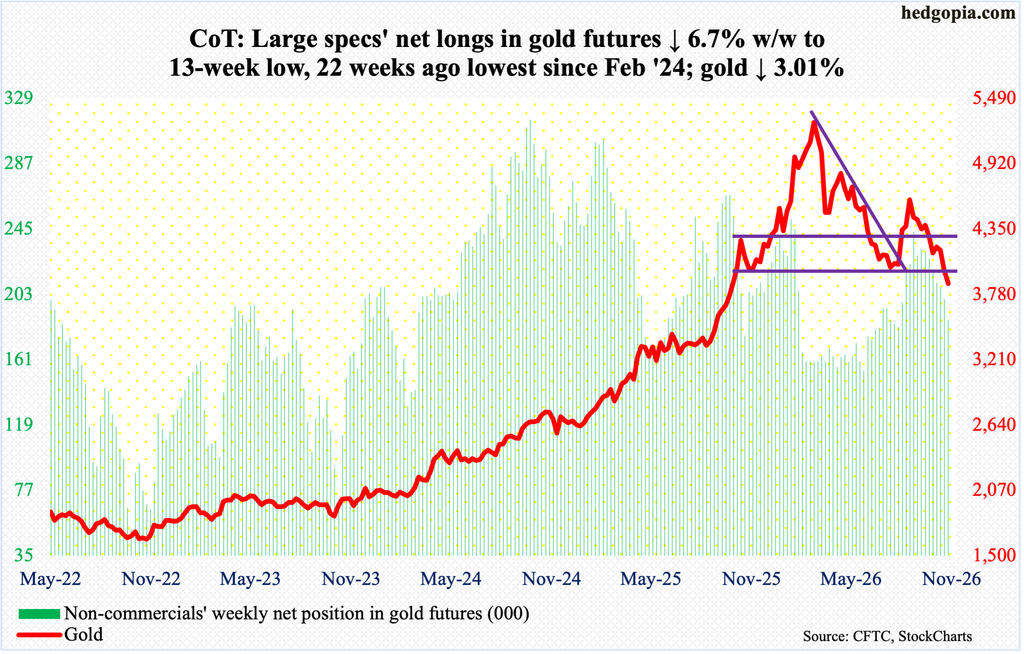
Last week’s close of $3,994 put gold right at crucial horizontal support of $3,900-$4,000, where it went sideways for six consecutive weeks in June-July this year before turning up.
The yellow metal earlier peaked at $5,608 on January 29 this year, rallying from $3,312 in August last year, and $1,810 in October 2023. On August 25 (this year), it began to retreat after tagging $4,697 intraday – yet another lower high since the January peak.
This week, gold gave back three percent to $3,874/ounce to compromise the $3,900-$4,000 support. Gold’s most recent downward pressure since the August high is in perfect sync with non-commercials’ reduction in holdings of net longs; in the week to August 25, they were net long 243,334 contracts, which are now down to the current 186,451.
If gold bugs are not able to stop the current downward momentum and rally the metal back above $3,900-$4,000, the next decent support does not lie until $3,440s.
Nasdaq (mini): Currently net long 48.8k, down 1.9k.
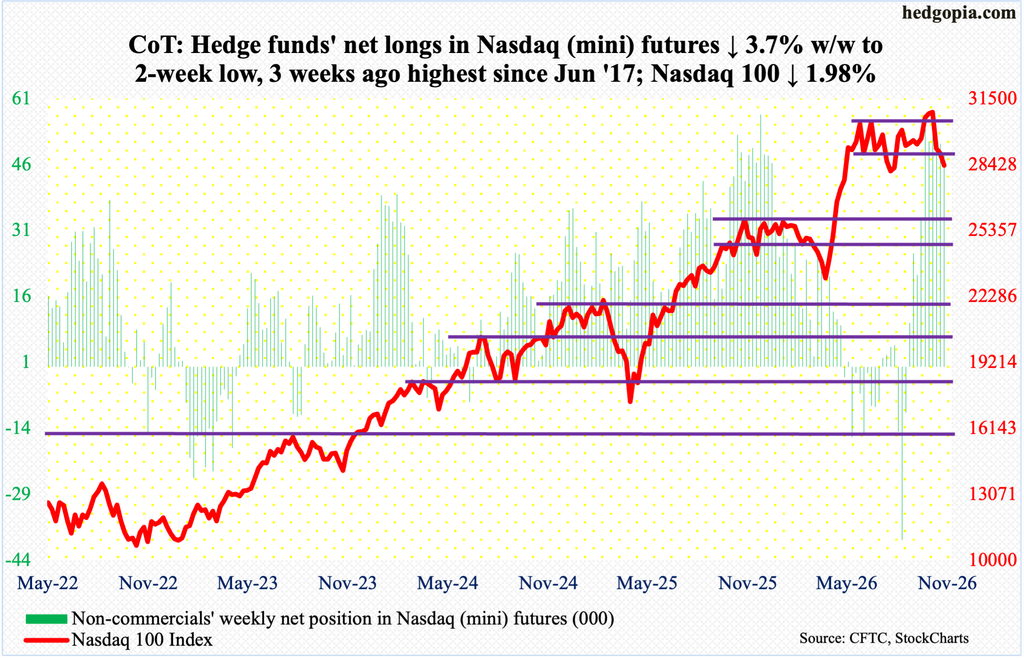
Until intraday Wednesday when the Nasdaq 100 tagged 29849 to go up 3.1 percent for the week, it was well on its way to put an end to two consecutive weekly declines, but the 50-day (29796) came in the way. The tech-heavy index gapped down on Thursday and Friday. When it was all said and done, the week finished lower two percent to 28385. Last week, the Nasdaq 100 closed at 28958 – right at horizontal support of 28800s.
This week’s dismal performance came even as the major tech companies such as Microsoft (MSFT), Google parent Alphabet (GOOG) and Amazon (AMZN) delivered strong numbers, but investors focused more on AI-related capital spending and commitments, and the share prices reacted negatively. Apple (AAPL) reports next Monday.
The Nasdaq 100 has taken it on the chin since hitting a fresh all-time high of 31361 on October 6. From the March 30 low of 22841 through that high, the index jumped 37.3 percent; going back further, it surged 89.6 percent from the April 2025 low of 16542.2. The overbought condition these gains caused is being unwound.
Friday’s session low 28093 drew bids, and this took place just above the 200-day (27927). We will find out next week if the average continues to hold ground.
Russell 2000 mini-index: Currently net short 36.1k, down 5.8k.
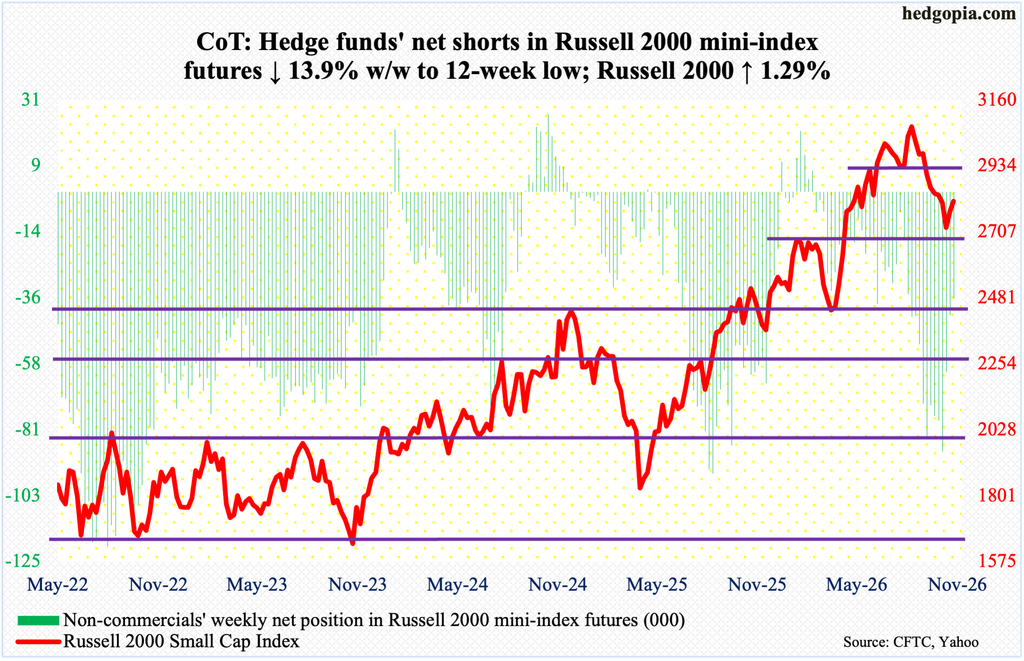
Last week, defending horizontal support at 2700, the Russell 2000 put an end to a streak of six weekly losses in a row – and eighth in nine. The small cap index earlier peaked at 3070 on August 14.
This week, the index picked up where it left off, rallying in the first four sessions, but Thursday’s session high 2868 faced two hurdles – the 50-day at 2860 and the underside of a broken trendline from April last year. Friday, the Russell 2000 was forced to test the strength of the 200-day (2805), with the index ticking 2787 and closing at 2812, up 1.3 percent for the week.
If this was a genuine – and successful – test of the 200-day, small-cap bulls’ mettle will be tested further next week to find out if they can topple the 50-day, followed by lateral resistance at 2880s. Else, the 200-day once again acts as a magnet.
US Dollar Index: Currently net long 14.1k, down 923.
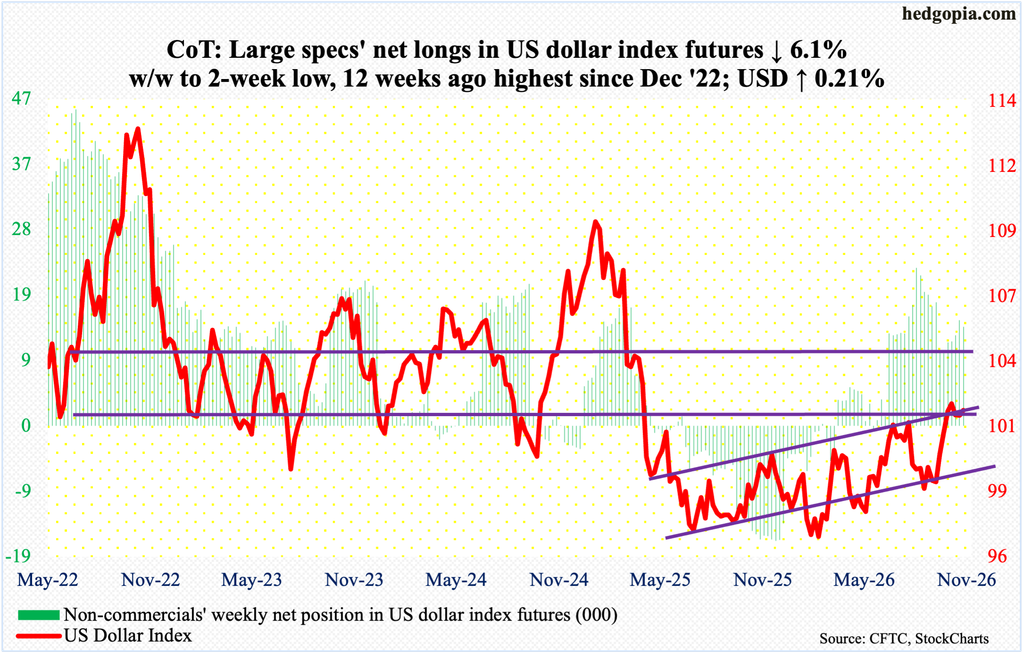
Dollar bulls this week tried to regroup and go after the recent highs but were only partially successful; the US dollar index rallied 0.2 percent to 101.96, but Wednesday’s session high 102.49 was frittered away.
On October 14, the index ticked 102.94, which was preceded by several sessions of intraday prints just north of 102.50. Earlier, the September 7 intraday low of 98.60 essentially tested the 98.56 reached on August 20-21.
The US dollar index had been under pressure since getting rejected at 101-102 for six weeks in a row in June-July. The significance of 100 – or just north of it – goes back to March 2015. This support is currently being tested, with rising odds of a breach soon.
VIX: Currently net short 77.5k, down 19k.
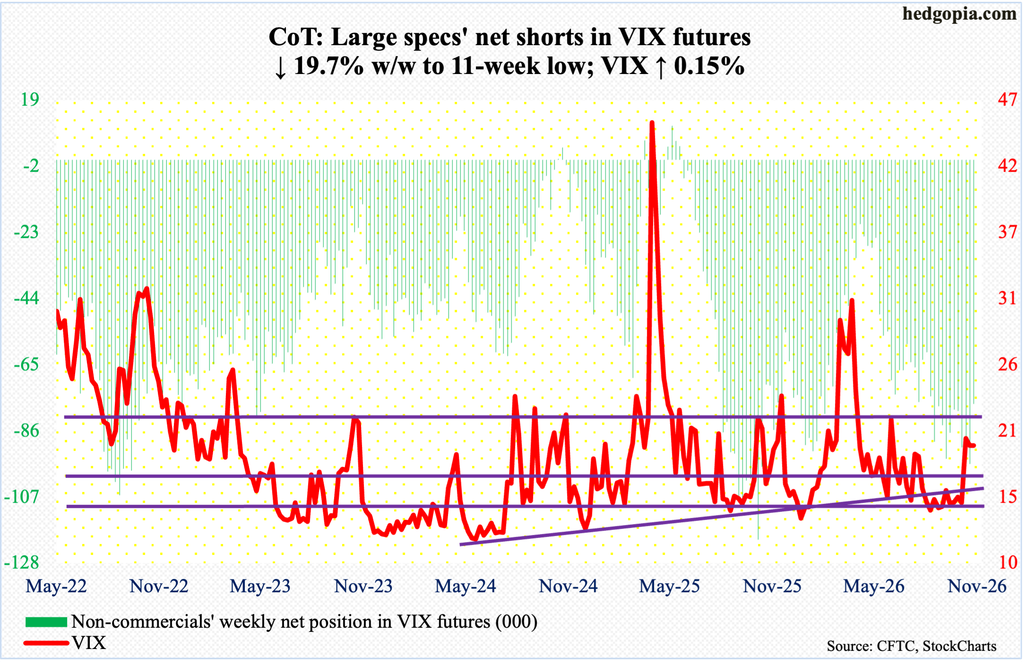
This week’s essentially flat close of 19.42 belies how volatile volatility was on Friday when VIX tagged 23.93 intraday but only to give back a significant amount of the session’s gains. The volatility index did finish the week above the 200-day (18.24), having earlier defended the 50-day (16.18) on Wednesday and Thursday.
VIX for now is itching to move up. How it acts around Friday’s high will be a big tell.
Thanks for reading!
