
Major equity indices hit the wall this week, with both the S&P 500 and the Nasdaq losing a rising trend line from the March 23rd low. They rallied massively off of that low, and odds favor continued unwinding of daily overbought conditions.
Tech has led since the March lows. Even within tech, large-caps are on the forefront. In QQQ (Invesco QQQ Trust), for instance, the share of Microsoft (MSFT), Apple (AAPL), Amazon (AMZN), Alphabet (GOOG/L) and Facebook (F) is over 45 percent (more on this here). In the S&P 500 large cap index, their combined share is just north of 21 percent – a record.
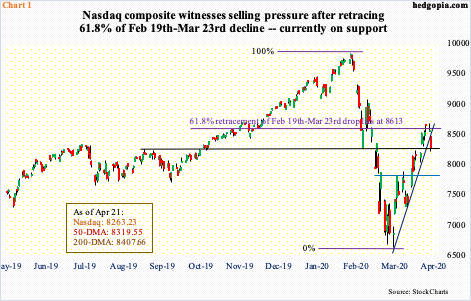
Momentum has been so strong the Nasdaq composite last week even managed to poke its head out of the 200-day moving average – the only one among major equity indices to do so. It also retraced 61.8 percent of the February 19th-March 23rd decline, with Monday’s intraday high of 8684.91 just past the Fibonacci retracement at 8613.32 (Chart 1).
As strong as this performance has been, with two sessions in, a chink in the tech armor developed this week.
On the daily, Monday’s shooting star followed last Friday’s hanging man on the Nasdaq (8263.23). Tuesday’s 2.5-percent decline sliced through both the 50- and 200-day. A rising trend line from the March 23rd low is now gone. Tuesday’s close was right on one-year horizontal support, so it is possible bulls will try to put their foot down but unwinding of daily overbought conditions has more to go on the downside. Next support lies around 7900.
Importantly, several weekly indicators such as the RSI are beginning to turn back down from the median. This is also the case with the S&P 500.
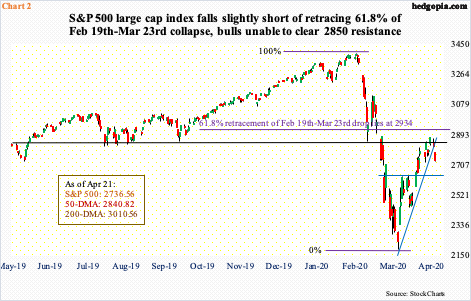
Last Friday, the S&P 500 barely edged past its 50-day, which was lost Monday, followed by a 3.1-percent decline Tuesday. Resistance at 2850s goes back to January 2018, and this held (Chart 2).
At Monday’s intraday high, the S&P 500 was also 55 points short of retracing 61.8 percent of the February 19th-March 23rd decline. Similar to the tech-heavy index, the S&P 500 (2736.56) Tuesday lost a rising trend line from that low. Nearest support lies at 2630s.
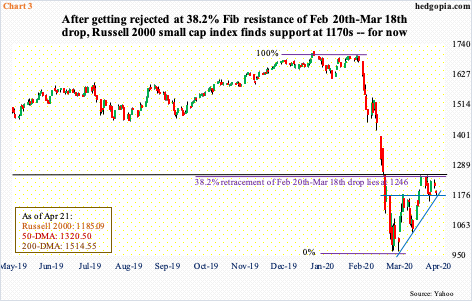
On the Russell 2000 small cap index (1185.09), similar support lies at 1170s, which was tested Tuesday (Chart 3). Right about here also lies rising trend-line support from March 23rd. This preceded important failure at 1250s. Right around there – 1246.11, to be exact – lies 38.2-percent retracement of the February 20th-March 18th drop.
Small-caps have lagged their large-cap brethren for a while now. And this did not change in the massive rally since the March low – as evidenced by retracement of merely 38.2 percent of the preceding decline. Immediately ahead, small-cap bulls may try to defend the dual support in question, but as is the case with both the Nasdaq and S&P 500, odds favor continued unwinding of daily overbought conditions near term.
Thanks for reading!
