After a decent rally in equities last week, this week has on the docket several potentially market-moving events – from FOMC meeting to mid-term elections to China trade. Longs can think of selling some covered calls.
Last week, two separate US data points showed a slight pickup in employee wages. Wage growth has been a consistent disappointment throughout this recovery/expansion, which is into its 10th year now.
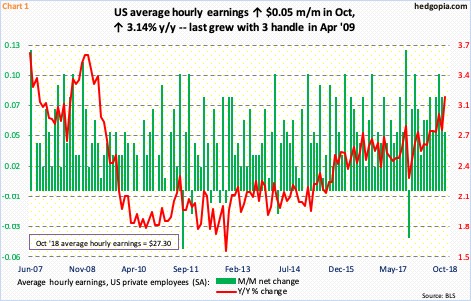
Average hourly earnings of private employees in October rose 3.1 percent year-over-year to $27.30. This was the first time since April 2009 that this metric grew with a three handle. In the big scheme of things, wages are still suppressed, particularly considering how mature the expansion is and considering inflation is at/near the Fed’s two-percent goal.
In the 12 months to September, core PCE (personal consumption expenditures) – the Fed’s favorite measure of consumer inflation – rose 1.97 percent, with growth of 2.03 percent in July, which was the first reading with a two handle since April 2012. Core CPI (consumer price index) has risen with a two handle since March this year.
That said, the y/y trend has been up since bottoming in October 2012 (Chart 1).
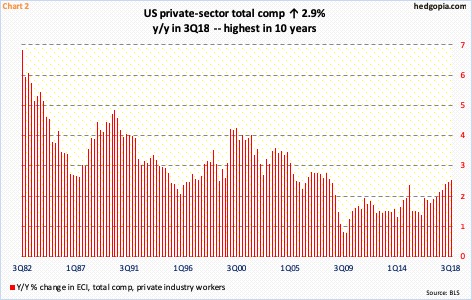
That is also the case with the employment cost index. Total compensation – comprised of wages and salaries plus benefits – for private-industry workers bottomed at increase of 1.2 percent y/y in 4Q09. In 3Q18, it grew 2.9 percent. This was the fastest pace since 2Q08 (Chart 2).
This in all likelihood gives FOMC hawks more reason to maintain their bias. After three 25-basis-point hikes this year, markets expect one more in December (18-19), with 79-percent odds in the futures market. Since December 2015, the fed funds rate has gone up by 200 basis points to a range of 200 to 225 basis points. Next year, the dot plot expects three more 25-basis-point increases. Markets are not as hawkish. So whenever data like last Friday’s come out, indigestion follows. Apart from the pickup in wages, non-farm payroll went up 250,000 in October. In the first 10 months this year, the economy created a monthly average of 213,000 non-farm jobs. In 2017, the monthly average was 182,000, versus 195,000 in 2016, 226,000 in 2015 and 250,000 in 2014.
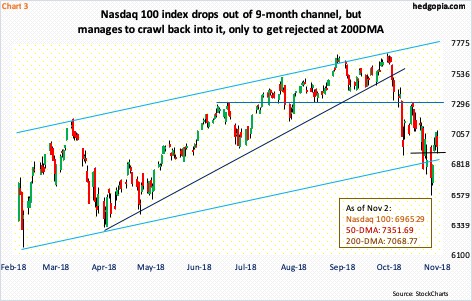
Last Friday, investors were already unnerved by Apple (AAPL)’s rather-underwhelming September-quarter report and guidance. As a result, major US indices struggled, the Nasdaq 100 index in particular. It shed 1.5 percent in that session. In contrast, the S&P 500 large cap index fell 0.6 percent, while the Russell 2000 small cap index rose 0.2 percent. The Nasdaq 100 (6965.29), in fact, tried to rally intraday, but was rejected at the 200-day moving average. This preceded a decent rally post-last Monday’s intraday reversal at 6574.75 (Chart 3).
In ideal circumstances, the Nasdaq 100 has room to rally, particularly on a weekly basis. But it also sustained quite a bit of damage during last month’s rout. Rejected at the upper end of a nine-month ascending channel in the beginning of the month, it went on to drop out of it toward the end, only to crawl back into it last week. Resistance is galore. Besides the 200-day, 7300 lies right above, which already repelled rally attempts mid-October. For now, gap-up support lies at 6930, a loss of which raises the odds of more downside pressure.
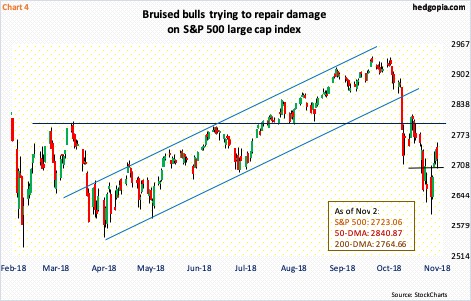
A similar gap-up support on the S&P 500 (2723.06), lies just north of 2700. Last Friday, it, too, just about tested the 200-day. Ideally, bulls would love to take out this average and go on to test 2800, which already resisted rally attempts on the 17th last month (Chart 4). This level also approximates the underside of a broken rising trend line from February 2016.
Failure to recapture the 200-day as soon as possible raises the odds of a retest of last week’s lows. As is the case with the Nasdaq 100, weekly momentum indicators are oversold on the S&P 500. Although in the very near term, things could go either way. Several daily momentum indicators have reached the median, which is as good a place as any for the index to turn back lower.
On the Russell 2000 (1547.98), last Friday produced a spinning top. But the index last week outperformed by a wide margin, up 4.3 percent, versus up 2.4 percent for the S&P 500 and up 1.7 percent for the Nasdaq 100. That said, small-caps also fell the most during the selloff. From the all-time high of August 31 to the low of October 26, the Russell 2000 collapsed 16.2 percent. For comparison purposes, the Nasdaq 100 between October 1 and 29 declined 14.6 percent, and the S&P 500 between September 21 and October 29 dropped 11.5 percent.
In the last couple of weeks, 16-month support at 1450-ish held on the Russell 2000 (Chart 5). This follows loss of one after another support, including a rising trend line from February 2016 and major horizontal support at 1610-ish. Ideally, small-cap bulls would like to go test that support-turned-resistance. The 200-day lies there as well. So does the underside of that broken trend line. Bulls need to defend support at just north of 1510.
Medium term, all these three indices have a long way to go before oversold conditions are unwound. Near-term is another matter. This week has at least three potentially market-moving events.
The FOMC begins a two-day meeting Wednesday. They are not expected to move in this meeting. But markets will be on pins and needles as to what they might say about the recent uptick in wages. Come Tuesday, the mid-term elections are held. And then the trade dispute with China (Chart 6). Last week, President Donald Trump was sounding optimistic about a possible deal with China, even as Larry Kudlow, National Economic Council director, was tamping down investor optimism. The issue of trade with China is not that simple. Just look at Chart 6. Year-to-September, China’s surplus was north of $301 billion. Last year was $376 billion. One simply cannot waive a magic wand and cause the US deficit to drop. It is complicated. Markets hate uncertainty.
Given all this, stocks in general could go in either direction this week – perhaps perfect time to sell covered calls. Hypothetically on October 15, a short put was initiated on SPY (SPDR S&P 500 ETF), which got put for an effective long at $271.22. It closed last Friday at $271.89. November 9th SPY 270 calls sell at $4.44. If called away, this ensures a profit of $3.22. Else, the price effectively drops to $266.78.
Thanks for reading!

