
After a rip-roaring rally since last October’s bottom, major US indices stopped at what could turn out to be make-or-break resistance. Sentiment is not frothy but elevated enough to cause unwinding, and multiples have only expanded since the end of 2022.
Last week, no sooner equity bulls rallied the major US equity indices to potentially crucial resistance than bears showed up in droves.
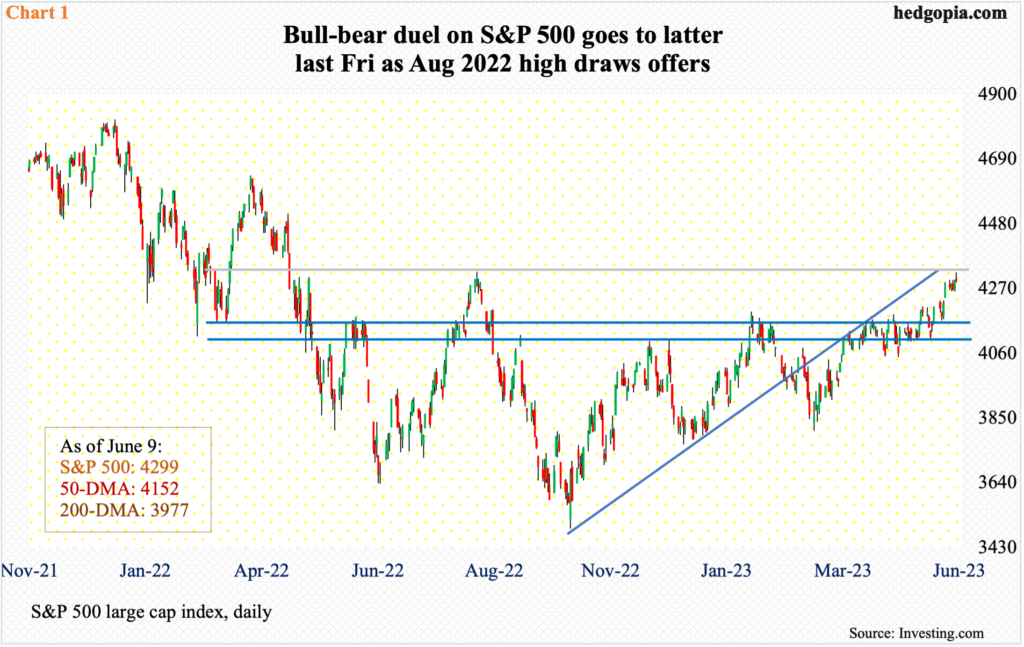
Last August, the S&P 500 tagged 4325 before dropping all the way to 3492 by October. From that bottom through last Friday’s high, the large cap index rallied 23.8 percent to test what could turn out to be important resistance; Friday’s intraday high of 4323 drew tons of offers, finishing the session at 4299 (Chart 1).
The index managed to rally 0.4 percent for the week but at Friday’s session high it was up 0.9 percent, which the bulls failed to save. When it was all said and done, the weekly formed a spinning top candle.
The daily is way overbought. Failure to save 4290 can result in a hurried retest of 4200.
Small caps met with the same fate.
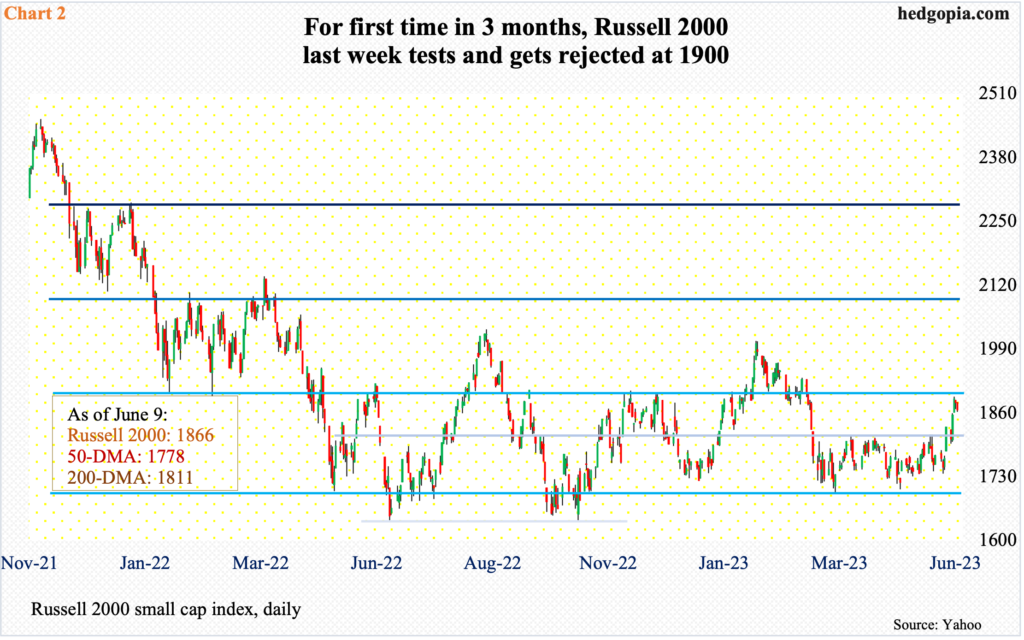
The Russell 2000 has been caught in a range between 1700 and 1900 since January last year (Chart 2). Support at 1700, in fact, goes back to August 2018.
The last time the small cap index was near 1900 was three months ago in March. After that, the range narrowed between 1700 and 1800, with the latter broken on the 2nd (this month). This was then followed by a quick rally to the top of the year-and-a-half range but only to get rejected.
The Russell 2000 rallied as high as 1894 last Wednesday, followed by intraday highs of 1880s on both Thursday and Friday, but only to reverse to end the week at 1866.
Odds of a test of 1800 in the sessions ahead have now grown. This is a must-hold.
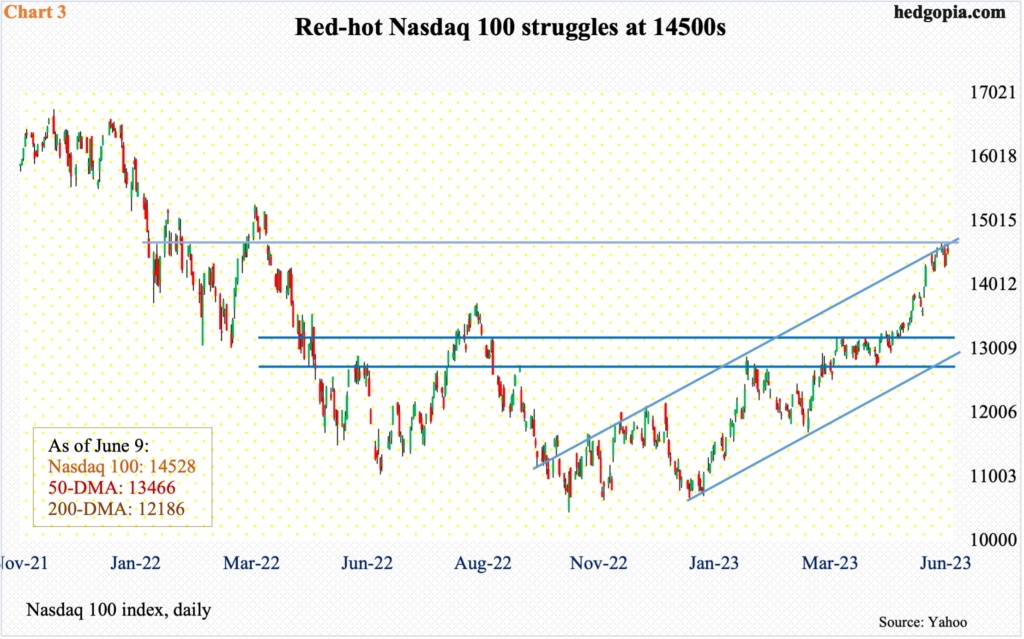
The Nasdaq 100, too, was unable to hang on to its gains. Through Friday’s high of 14673, the index was up 0.9 percent for the week. Tech bears, who have otherwise been shellacked this year, proved a little too strong at that point, with the week inching lower 0.1 percent, forming a weekly spinning top. This followed six straight up weeks and the prior week’s candle which tech bulls argue is a bullish hammer but could very well turn out to be a hanging man.
From last October’s low through last Friday’s high, the tech-heavy index jumped 40.5 percent. Having shown up after such a massive run, odds favor the prior week’s candle is a hanging man, which will be bearish. Last week’s spinning top can embolden the bears.
The Nasdaq 100 is struggling to decisively take out 14500s, which represent both horizontal resistance and the top of an ascending channel from last October (Chart 3). Last week, it touched 14673 intraday Friday but closed at 14528. Continued inability to break out opens the door to a retest of 13100s.
Since last October’s low, equity bulls undoubtedly have done a great job. They are sitting on loads of paper profit. Any new money that wants to come in at this stage will obviously wonder about investor sentiment and valuations, among others.
Sentiment is not frothy but has risen enough to be pushed into overbought territory.
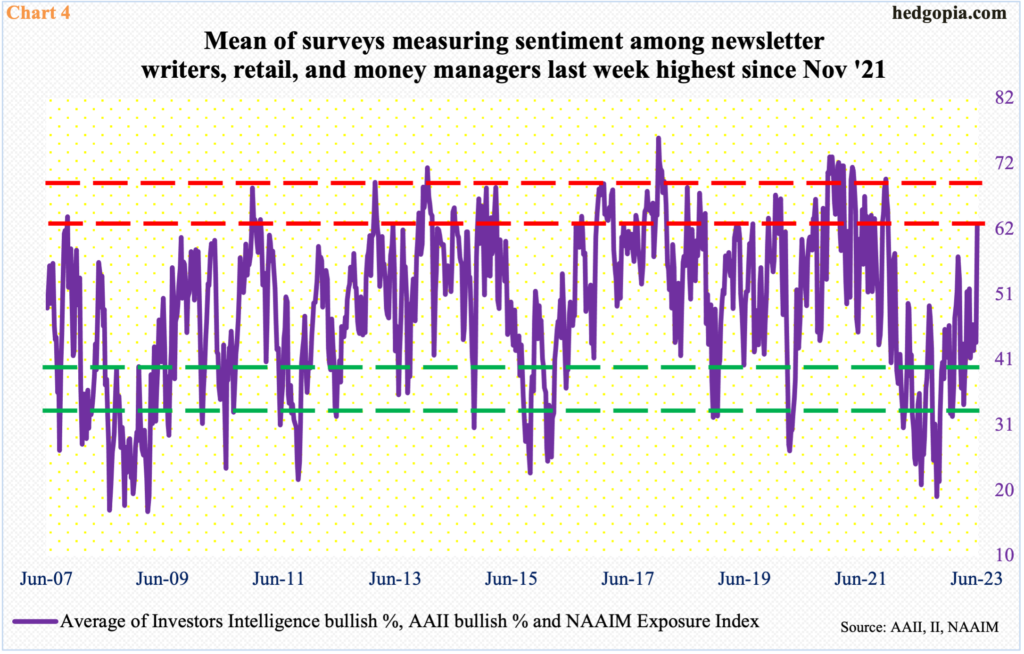
Chart 4 combines three different surveys measuring three diverse groups. Investors Intelligence is a survey of newsletter writers, who cater to paying subscribers. The American Association of Individual Investors surveys its members, so it is a good reflection on individual mood. And the NAAIM Exposure Index surveys how money managers are positioned, with the index measuring National Association of Active Investment Managers members’ average exposure to US stock markets.
In the week to June 6, Investors Intelligence bulls hit 51.3 percent, while AAII bulls reached 44.6 percent in the week to June 8, and the NAAIM index rose to 90.1 in the week to June 7. All these three readings were the highest since November 2021. The average of the three was 62 – once again the highest since November 2021 – and it is elevated enough a process of unwinding can begin anytime (Chart 4).
The other crucial factor for new money to consider at this point is rising multiples.
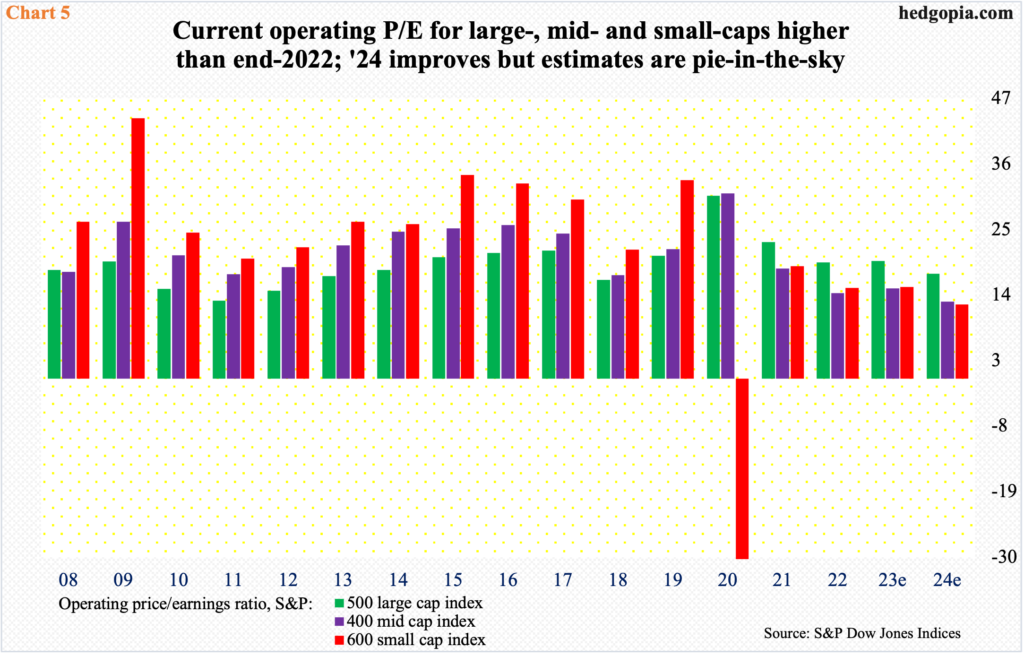
When 2022 ended, large-, mid-, and small-caps – measured by the S&P 500, 400, and 600 – sported an operating price-to-earnings ratio of 19.5x, 14.4x, and 15.2x. At the time, S&P 500 companies were expected to bring home $226.49 this year, S&P 400 $185.11, and S&P 600 $92.67. Nearly six months later, the sell-side has revised their numbers lower to $218.29, $167.87, and $78.37, in that order. Concurrently, the S&P 500 rallied from 3840 at the end of 2022 to 4299, the S&P 400 from 2430 to 2542, and the S&P 600 from 1158 to 1201. The P/E ratio on this year’s earnings has firmed up to 19.7x, 15.1x, and 15.3x (Chart 5).
The multiples contract on next year’s earnings, but 2024 estimates are hardly reliable. The sell-side is notorious for starting out optimistic and lower the numbers as the year progresses – as is evident in how 2023 is evolving.
As things stand, 2024 earnings are expected to grow 12 percent to $244.47 (S&P 500), 17.6 percent to $197.49 (S&P 400), and 23.4 percent to $96.67 (S&P 600)! They are nothing but pie-in-the-sky, and multiples derived thereof are not trustworthy.
Thanks for reading!
