
Woulda, Coulda, Shoulda! What could have been $9.93 in profit in a hypothetical XLE trade is now only worth $1.83. Culprit? Trying to play it too cute plus greed.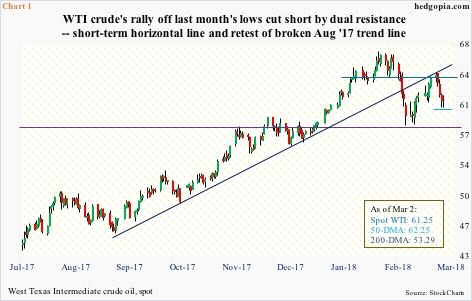
Since peaking on January 25 at $66.66/barrel, spot West Texas Intermediate crude came under decent pressure, dropping to $58.07 by February 9 before bids showed up. In the next few sessions, support at $58-59 was again tested, and it held (Chart 1).
The subsequent rally had the crude rallying to $64.24 by last Monday. This area held dual resistance – short-term horizontal line at $63-64 combined with a broken trend line from last August. Thus far, the retest has failed.
During all this, the 50-day moving average has been lost.
For now, the crude is in no man’s land, caught between $64 and $58.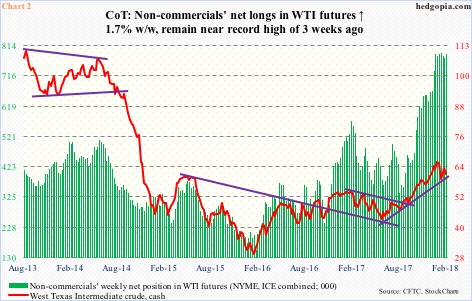
Non-commercials are acting as if they expect a breakout.
As of last Tuesday, they held 787,079 net longs in WTI futures, up 1.7 percent week-over-week, only 3,616 contracts short of the record 790,695 from three weeks ago.
These traders follow the trend, and as Chart 2 shows, do a pretty good job at it. Inflection points are different, though. Are we at one? Tough to say, but this much we know, optimism among non-commercials is very high.
One of the data points they are likely focused on at this point in time is crude inventory.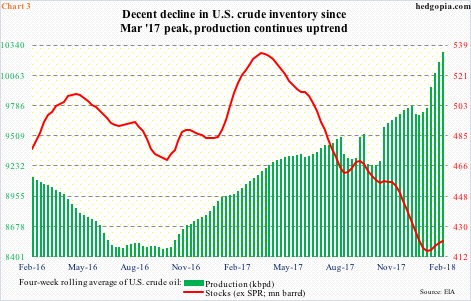
U.S. crude stocks peaked at 535.5 million barrels in the week through March 31 last year, then bottoming at 411.6 million barrels in the week through January 19. As of February 23, stocks stood at 423.5 million barrels.
Chart 3 presents a four-week rolling average of both crude stocks and production. And the drop in the red line since the peak last year is clear. It has risen slightly in the last four weeks, but nothing crazy.
But then there is another side to this story, which is production. And it continues higher. As of February 23, production was 10.3 million barrels per day.
Since late November 2016, U.S. production has gone up by 1.6 mbpd. That was when OPEC, along with Russia, decided to cut their production by 1.8 mbpd. The agreement runs through this December. Essentially, OPEC giveth and U.S. shale taketh away.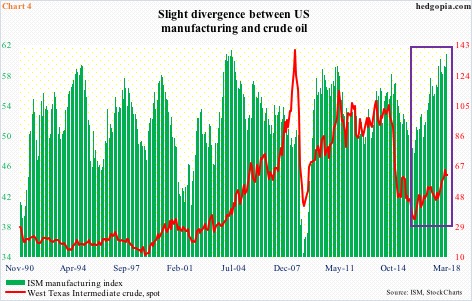
This is probably why the price of WTI crude of late has kind of diverged from U.S. manufacturing.
The ISM manufacturing index in February rose 1.7 points month-over-month to 60.8. This was the highest since 61.4 in May 2004 (Chart 4). It has come a long way from January 2016 when the index bottomed at 47.8. WTI bottomed at $26.05 in February that year. It, too, has come a long way.
However, the last time WTI was north of $100 was in July 2014, right before beginning a waterfall dive.
Of course, it is not always that simple. The two don’t have to absolutely track hand in hand. Directionally, they are still moving together. But the crude is rallying less. As a matter of fact, it peaked in January. It is possible oil is anticipating possible – even probable – weakness in manufacturing in the months ahead. Manufacturing remains very strong, and at least a breather is due.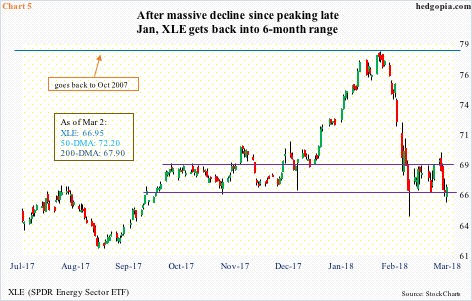
Given all this, where might XLE (SPDR energy sector ETF) be headed? The short answer is, at least near term it could go either way.
XLE ($66.95) peaked at $78.39 on January 24. Resistance at that level goes back to October 2007 (Chart 5). Three sessions prior to that, the ETF was hypothetically shorted at $76.88. This is now worth $9.93. Great, except for the fact that this was done in conjunction with two March 2nd 71 short puts for $0.25 each. Back then, the strikes approximated the 50-day, and it was assumed that the average would not break right away. Wrong assumption!
Another opportunity was wasted last week, as the underlying rallied to $69.90 intraday last Tuesday – right into the sharply falling 20-day. A closure then would have been much more profitable. Greed came in the way.
Hindsight is always 20/20, but that tiny premium of $0.50 proved costly. The puts expired last Friday $4.05 in the money. As a result, the trade now has two longs at $71 each versus one short at $76.88. A closure, still worth $1.83, makes sense.
In the recent selloff, the bulls defended a rising trend line from January 2016, but the ETF is still below the 200-day. It has traded in a two-point range for nearly six months now. This should continue until it breaks one way or the other.
Thanks for reading!
