
Last Friday, post-Brexit win, the 10-year Treasury yield declined 16 basis points to end the session at 1.58 percent. It fell as low as 1.53 percent at one point during the session. The drop ensured 10-year yields remained below support at 1.65 to 1.7 percent, which stretches back to September 2011 (Chart 1). This was the third straight week yields remained below that level.
Nevertheless, the all-time low of 1.39 percent, in July 2012, stands (arrow in Chart 1). The question is not if in due course 10-year yields approach/even breach those lows, but when. Lots of people are wondering if Brexit proves to be the catalyst that will trigger this.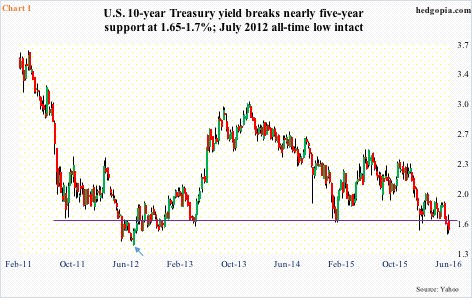
Investors have been flocking to “safe-haven” government bonds everywhere, and doing so for a while, to the extent that in several countries yields have gone negative. Japanese 10-year government bonds yield minus 0.18 percent. Ditto with Germany’s which yield minus 0.05 percent. Switzerland is at minus 0.56 percent. Italy and Spain yield less than the U.S.’s, while France’s is at 0.38 percent. And, on and on.
This does not happen when the outlook for economic growth is getting brighter.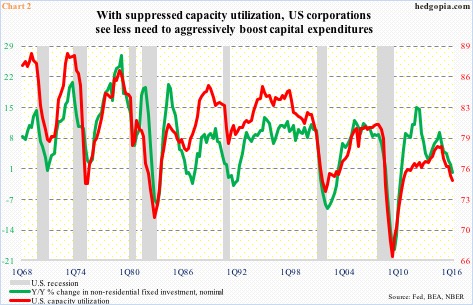
Just focusing on the U.S., real GDP grew 0.8 percent in 1Q16. Post-Great Recession, the economy has only managed to grow at an annual rate of 2.1 percent, much slower than the 3.2-percent average since 2Q47. Business capex remains suppressed.
Chart 2 plots year-over-year change in nominal non-residential fixed investment against U.S. capacity utilization. They track each other well. In 1Q16, the green line contracted 0.3 percent – first negative reading in six years. Capacity utilization in March was 74.8 percent, having peaked at 78.9 percent in November 2014. In the current cycle, utilization did not even cross 80 percent before peaking.
So why invest, and who can blame corporate boardrooms for not doing so?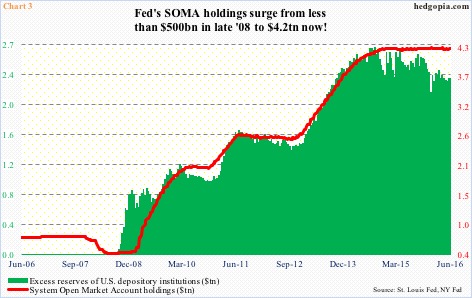
Viewed this way, the trillions of dollars the Fed created post-financial crisis have been up to no good when it comes to the economy.
Back in November 2008, the Fed’s System Open Market Account holdings were $482 billion. After three iterations of quantitative easing (QE), it now stands at a massive $4.2 trillion (QE 3 ended in October 2014). Banks’ excess reserves grew alongside – from around $600 billion to $2.3 trillion (Chart 3) – earning 0.5 percent interest.
Major central banks have tried everything – from zero interest-rate policy to QE to, in the case of the Bank of Japan and the European Central Bank, negative interest rates. The desired outcome has eluded them.
Noticeably, central bankers are now dropping hints here and there that they are realizing there are inherent limits to monetary policy. They are increasingly calling for fiscal help – the ECB in particular at the moment.
Enter Brexit. How bad can it get, or is it contagious?
With equity bulls saying Brexit is a non-event and bears arguing it is a contagion, the average investor is bound to get confused.
The fact is, it is too soon to tell. Britain has not even invoked article 50 of the Lisbon Treaty. Will it ever or will it in the end go for a face-saving deal with Brussels? Time will tell.
For the moment, one can come up with various scenarios in which Brexit is Lehman-like, as some argue, much the same way one can come up with scenarios in which its impact will be contained. All this will take time to unfold. And this uncertainty is not something that will be welcomed in corporate board rooms. This is a medium- to long-term worry.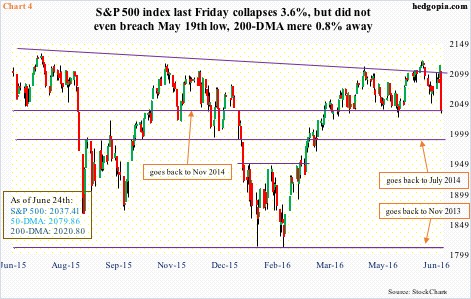
If Brexit is a contagion, equities are not even remotely priced for this scenario.
The S&P 500 large cap index was thrashed for a 3.6-percent tumble last Friday, slicing through the 50-day moving average as well as shorter-term moving averages. Even after this drop, the May 19th low was left intact.
Further, the S&P 500 has gone sideways since February last year, with several failed attempts to jump over this hurdle as well as over a declining trend line from the May 2015 peak (Chart 4). That said, with the Friday drop, it is 4.6 percent from the May peak. In the larger scheme of things, this is nothing. Longs are hanging tough, which, in the event that Brexit turns out to be a contagion, will come back to haunt later.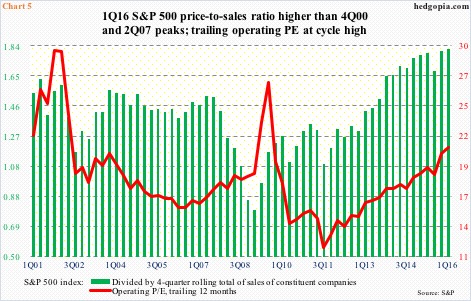
Particularly considering Chart 5. Multiples are extended, to put it mildly.
Using a four-quarter rolling total of sales for S&P 500 companies, the price-to-sales ratio in 1Q16 stood at a record 1.83. This is higher than 1.52 in 2Q07 and 1.77 in 4Q00.
Along the same lines, the red line in Chart 5 represents the price-to-earnings ratio using a four-quarter rolling total of trailing operating earnings. On this basis, 1Q16 was 20.9 – hardly cheap and the highest since 3Q09; although 3Q09 and 4Q01 were higher.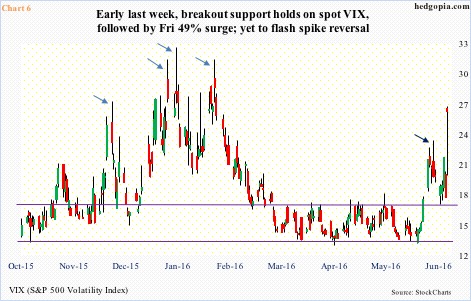
This is one reason why longs are hanging on but at the same time seeking protection. Spot VIX is not in the 30s, or 40s, or even 50s, as was the case not too long ago (north of 53 last August), but is acting strong, closing just under 26, and near session highs, last Friday (Chart 6).
This is also a time nimble potential longs can start looking for signs of a spike reversal in spot VIX. The June 16th reversal looked/acted like one (dark blue arrow in Chart 6) but that was before the Brexit curve ball. The S&P 500 is merely 0.8 percent away from its 200-day moving average, and that is a place for the bulls to try to put their foot down. Should this happen, this probably gets reflected in VIX. Oncce that bounce comes, what happens around the 50-day moving average will be a tell.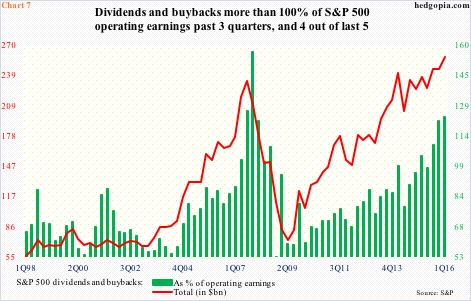
More important, buybacks have been the bulwark of this bull market, with S&P 500 companies spending nearly $3 trillion through the first quarter.
Back in January, in the midst of a sell-off, these companies stepped up to the plate, purchasing $161.4 billion in shares, second only to the all-time high $171.9 billion in 3Q07. Combined with dividends, they spent $257.7 billion – an all-time high.
There is the rub. Dividends and buybacks constituted 123.3 percent of operating earnings in 1Q16. In four out of the last five quarters, the green bars in Chart 7 exceeded 100 percent. Needless to say, this is unsustainable. And now corporate boardrooms are having to weigh Brexit repercussions. Will they be as committed to share repurchases as pre-Brexit? Will be a big tell.
Thanks for reading!
