
The FOMC meets this week. Stocks are adjusting to an increasingly hawkish Fed, which is belatedly alarmed by the persistently rising inflation. At some point, the long end of the treasury yield curve is likely to cry uncle, putting earnings estimates at risk.
It was not too long ago that the majority viewed markets’ expectations for two 25-basis-point hikes this year was viewed as too optimistic. The Jerome Powell-led Fed firmly believed that the increase in inflation was transitory and that they did not expect to move this year.
Fast forward a few months, and the whole thing has been turned on its head. In late November, Powell told Congress that it is “probably a good time to retire that word.” Persistent inflation forced his – and his team members’ – hand.
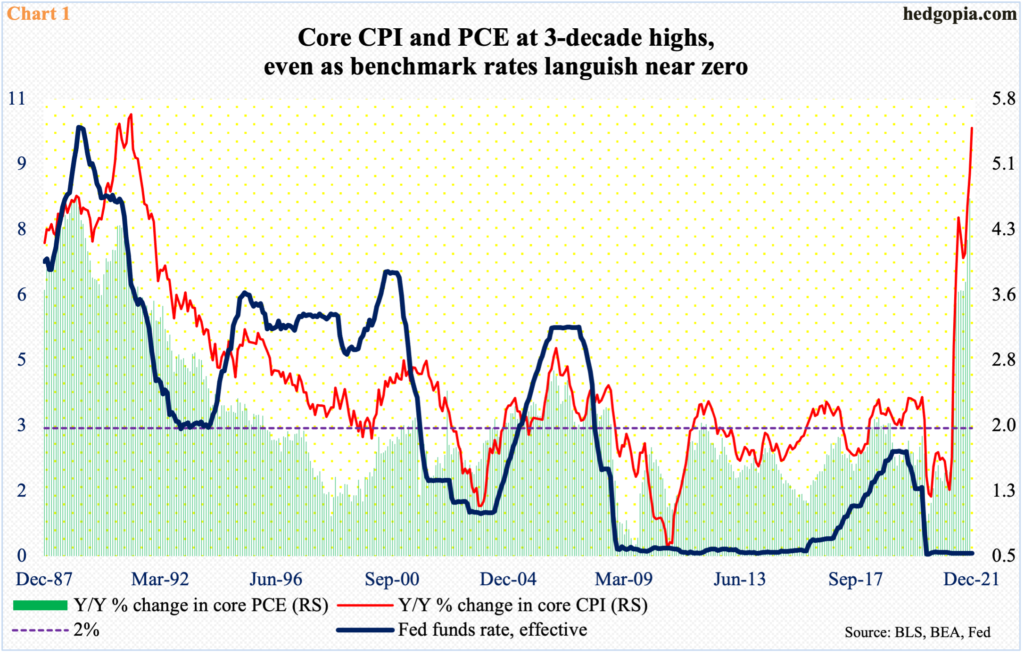
In the 12 months to December, core CPI (consumer price index) jumped 5.5 percent. This was the steepest price rise since February 1991. As recently as last February, this metric was rising at a subdued 1.3 percent pace. In that same month, core PCE (personal consumption expenditures), which is the Fed’s favorite measure of inflation, rose 1.5 percent. December’s numbers are due out this Friday, with November having posted a 4.7 percent increase year-over-year; core PCE has not been this high since February 1989 (Chart 1).
As the FOMC meets this week, the focus will have shifted to its ‘price stability’ mandate. Until recently, it solely focused on its ‘maximum employment’ mandate, letting inflation roots go deeper and allowing all kinds of asset prices to run amok, not the least of which are equities.
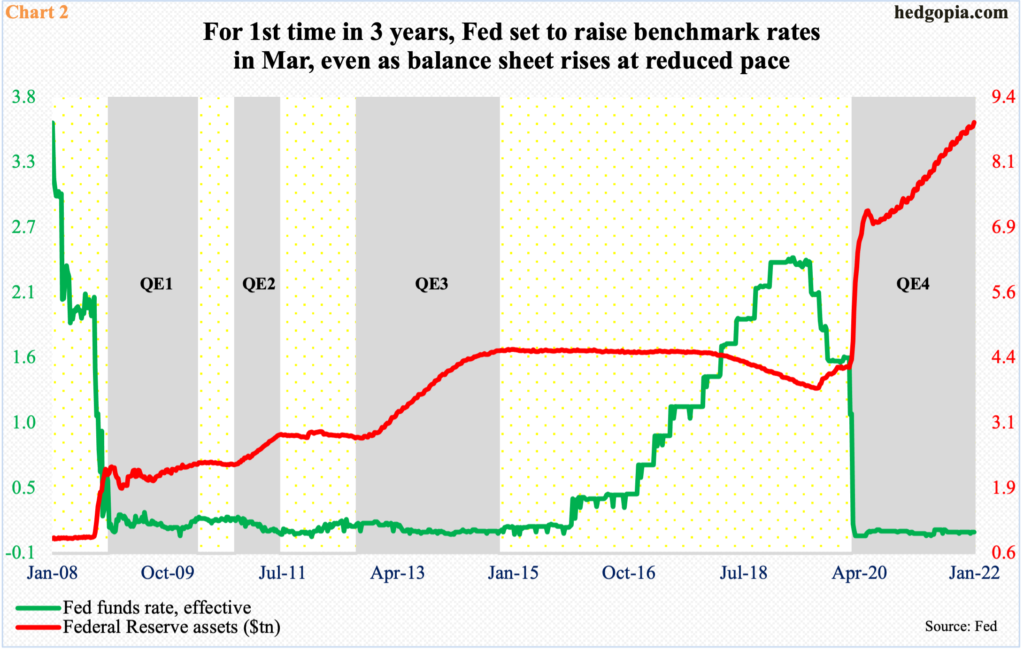
The Fed is already tapering what until recently was a $120-billion/month bond-buying bonanza. Its asset base – $8.9 trillion, up from $4.2 trillion in early March 2020 – is still growing, but at a reduced pace. Markets also expect the Fed to raise rates in March, which will be the first hike in three years (Chart 2). In fact, futures traders expect three more 25-basis-point hikes before 2022 is out. Several brokerage houses are calling for more.
Even after this, rates will remain low. In the middle of 2019, the fed funds rate was just under 2.5 percent (Chart 2). Now, it is in a range of zero to 25 basis points. The message coming out of the Fed is that it is ready to take the punch bowl away. Stocks do not like the sound of that.
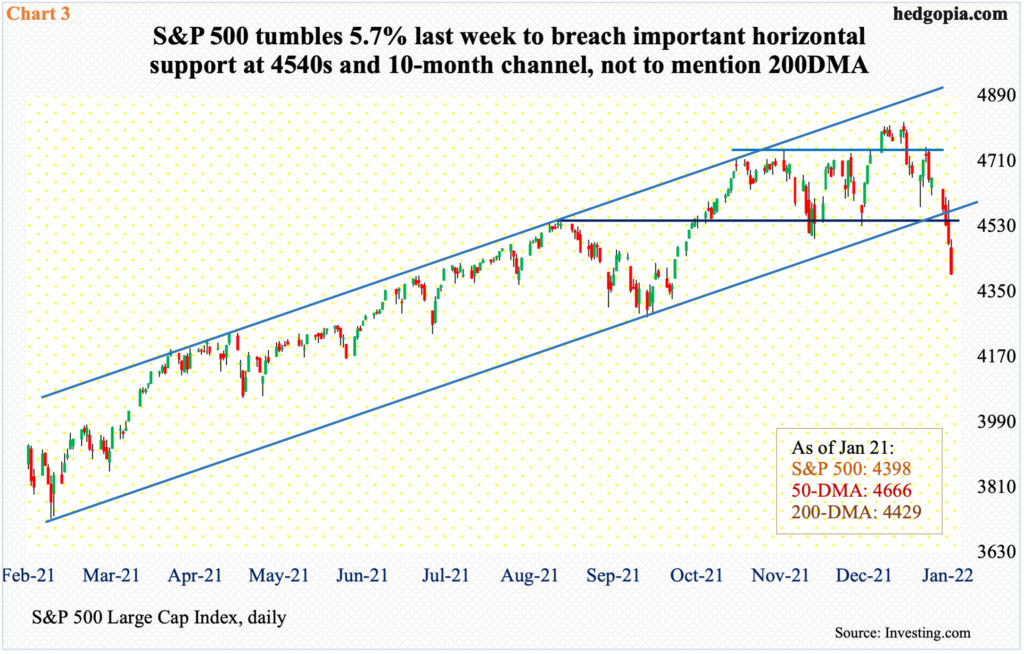
January-to-date, the S&P 500 (4398) is down 7.7 percent. Last year, the large cap index rallied 26.9 percent. Earlier in March 2020, it bottomed at 2192, then peaking at 4819 on the 4th this month. There is a lot of optimism built into this surge, and investors are having to rerate their expectations.
In the last three sessions last week, intraday rally attempts were sold hard (Chart 3). This is a slight change in investor attitude and a chink in the buy-the-dip armor. The 200-day (4429) has been breached, for a weekly bearish marubozu candle last week; this followed the prior week’s spinning top.
Nearest support lies at 4280s.
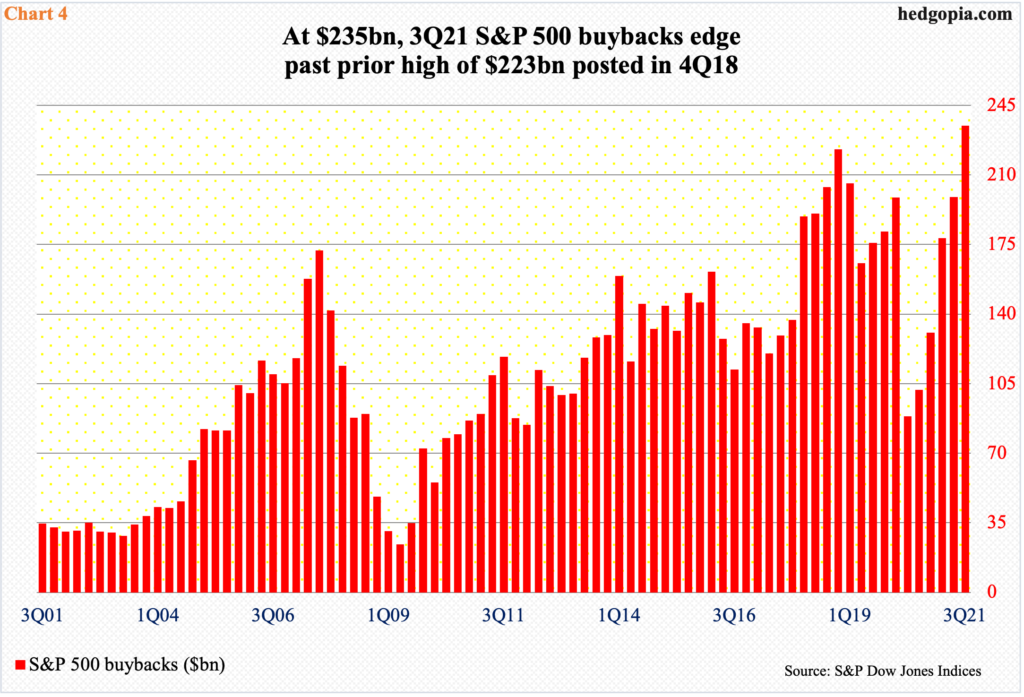
By insisting nearly all of last year that there was not much to worry about inflation, the Fed not only lit a fire under equities but likely also influenced corporate decisions. Boards, which likely were led to believe that the good time was here to stay, splurged on buybacks, among others.
In 3Q21, S&P 500 companies spent $234.6 billion on buybacks. This surpassed the prior quarterly high of $223 billion from 4Q18. In 2Q20 – amid uncertainty post-pandemic – buybacks languished at $88.7 billion. Then, as the system got flooded with both fiscal and monetary stimulus, share repurchases rose in each quarter, posting a fresh record in 3Q21 (Chart 4). This reflects corporate boards’ ebullient mood. And why not?
Earnings were coming in better than expected.
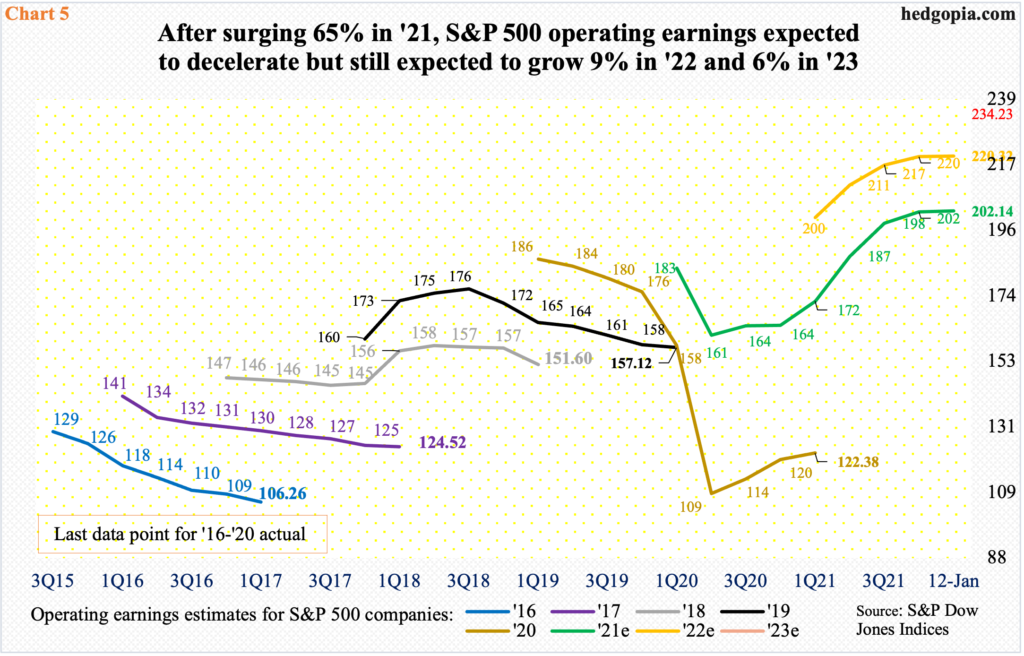
In 2020, S&P companies brought home $122.37 in operating earnings; in April 2019, pre-pandemic, the sell-side had penciled in $186.26. Also for 2021, up until March 2020, these analysts expected $187.65. As the virus disrupted the global economy, knives came out, with estimates bottoming at $160.89 in July 2020. With three quarters gone and 4Q currently being reported, blended 2021 estimates are on course for $202.14, up 65 percent from 2020.
The growth rate is expected to decelerate to nine percent to $220.32 this year and to six percent to $234.23 next (Chart 5), but it is obvious companies remain optimistic in their guidance.
Until recently, all this looked within reach. With the new interest rate outlook, doubters’ count in all probability will begin to rise.
Last week, we saw this begin to unfold in the small-cap arena.
By nature, small-cap companies tend to have larger exposure to the domestic economy versus their larger-cap brethren, which also have international exposure. Small-cap performance hence is a way to tell which way investors think the US economy is headed in the quarters to come.
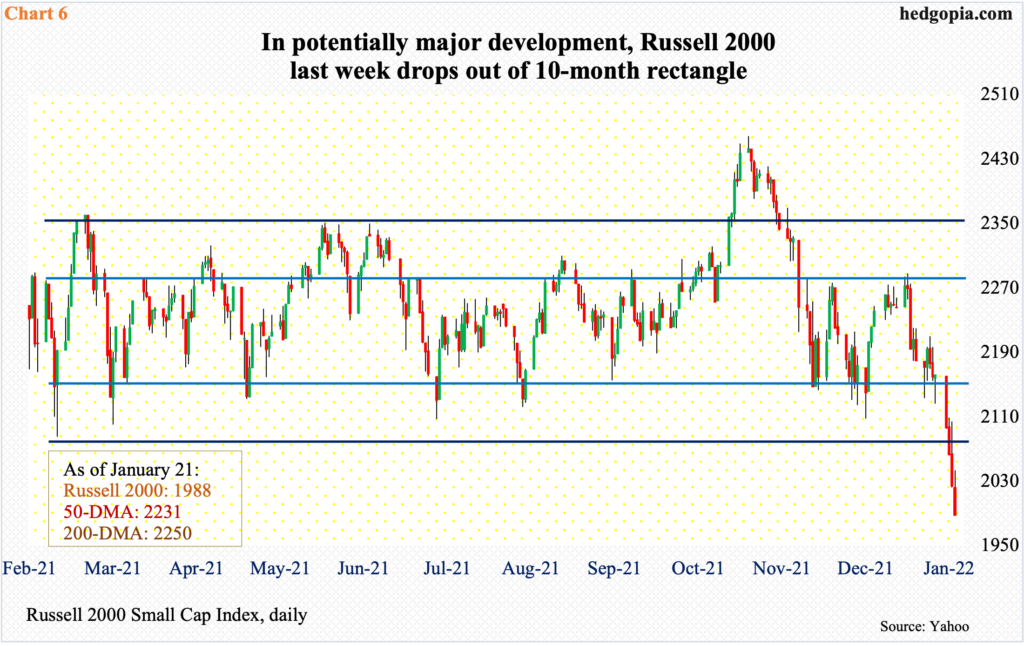
Last week, the Russell 2000 broke down, dropping out of a months-long rectangle.
Since March last year, the small cap index has been rangebound between 2350s and 2080s, and between 2280s and 2150s within this box. On Nov 3, it broke out but was quickly followed by a failed retest on the 19th (Chart 6).
Unless last week’s breakdown is false the same way last November’s breakout was, it has the potential to be a major development.
In the weeks and months ahead, a similar message on economic deceleration could come from the treasury yield curve.
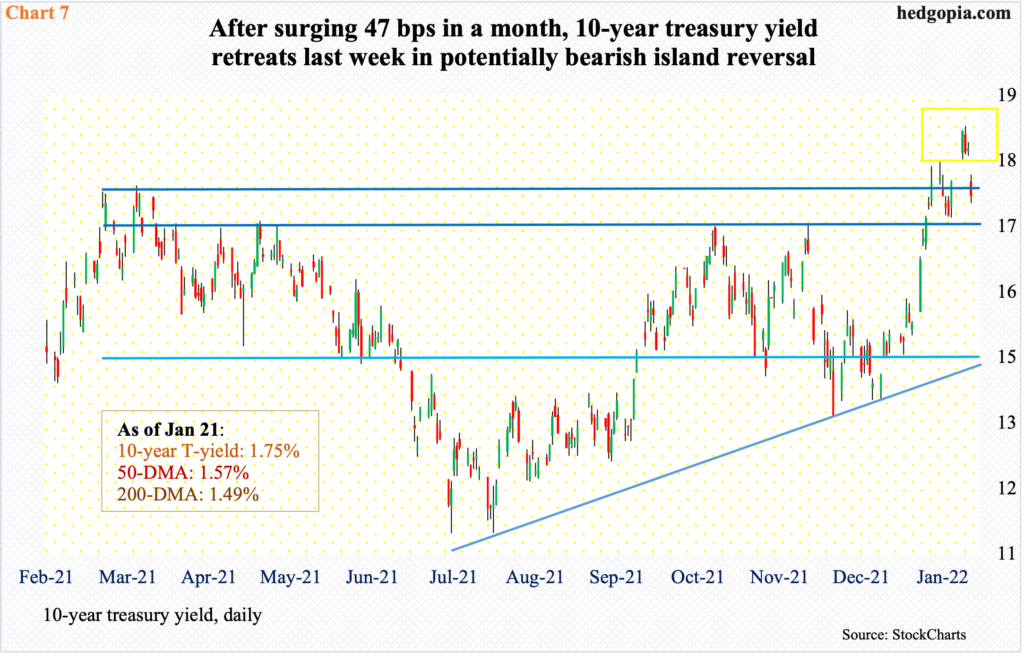
Last September, two-year treasury notes were yielding in the low-20s. Now, they yield just north of one percent. These rates tend to be the most sensitive to monetary policy expectations. The 10-year yield similarly was 1.13 percent last August and touched 1.87 percent last Wednesday.
Last week’s high, which was the highest in two years, has the potential to be an important high. Rates closed last week at 1.75 percent, retreating after charting out a potentially bearish island reversal (yellow box in Chart 7).
Given the move the 10-year has had and the damage it is likely to inflict on the economy, not to mention the impending rise in the short end of the curve, the current price could gradually begin to attract bond bulls (on price). Inability to hold 1.69 percent will be the first sign this is happening. In this scenario, rates could drop all the way to test mid-1.40s, resulting in a massive flattening of the curve and putting earnings estimates at risk.
Thanks for reading!
