US equity bears had an excellent opportunity to push prices lower. Indices did come under pressure. But it looks like once again bulls managed to put their foot down on time.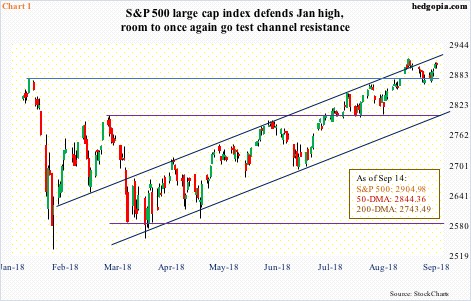
The S&P 500 large cap index made a new all-time high of 2916.50 on August 29, before coming under pressure. By then, it had rallied 9.1 percent for the year. Conditions were overbought on nearly all timeframe. Investor sentiment was elevated. This was an opening for the bears, and they took it. Through September 7 intraday, the index fell 1.8 percent. And that was it. Bulls essentially defended the high from late January when the S&P 500 fell for a quick, double-digit decline after peaking at 2872.87 on the 26th (Chart 1). The 20-day moving average was tested several times last week and the week before, and it held.
Medium- to long-term, there are still risks. On momentum indicators such as the RSI, divergence is developing. Near term, however, bulls have improved their chances. When the S&P 500 (2904.98) retreated 13 sessions ago, it did so after facing resistance at a seven-month channel. If it goes on to test the upper bound, it has room to rally to a new high.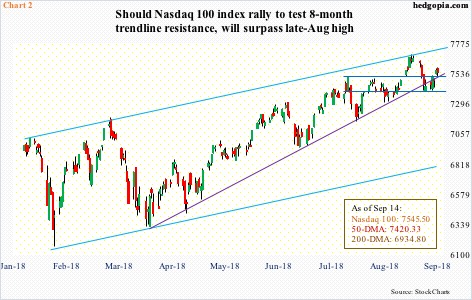
Over on the Nasdaq 100 index, after peaking at 7691.10 on August 30, it quickly shed 3.8 percent intraday in the next five sessions. Short-term support at 7500 was gone. Briefly, a rising trend line from early April was lost as well (Chart 2). But the bulls were not willing to let go of the 50-day. In the past two and a half months, this was a third test of the average. The first two resulted in successful defense, eventually resulting in a new high. This time around, the index hovered around the average for five sessions before rallying off of it last Thursday. Shorter-term averages have been recaptured.
Since peaking late January, the Nasdaq 100 (7545.5) has consistently made higher highs and higher lows. The upper bound currently extends to 7750, which is what longs are probably eyeing near term.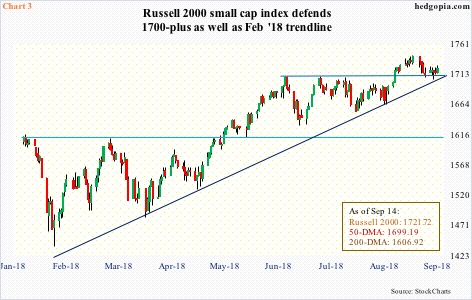
Of late, the otherwise risk-on Russell 2000 small cap index has been a laggard. Last week, it rallied 0.5 percent, versus 1.2-percent increase for the S&P 500 and 1.6 percent for the Nasdaq 100. In eight sessions between August 31 and September 12 intraday, it too lost 2.2 percent. But once again as was the case with the other two indices, bulls defended crucial support on the Russell 2000.
Since February, small-cap bulls have consistently showed up at/near a trend line drawn from that low. This continued last week (Chart 3). Plus, the Russell 2000 went sideways for two months after rallying to 1708.1 on June 20. Post-breakout on August 21, it went on to rally to a new high of 1742.09 on August 31. Retest of the breakout was successful.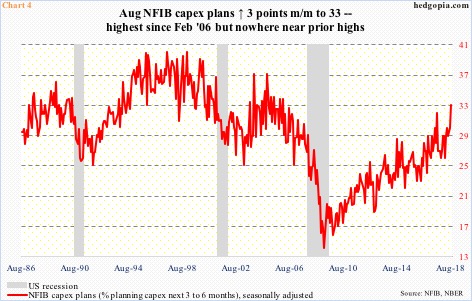
If a measured-move target of the breakout in question fulfills, bulls would be eventually eyeing 1780s on the Russell 2000 (1721.72). In the past, short squeeze helped. Most recently, short interest on IWM (iShares Russell 2000 ETF) peaked at 96 million mid-February, when US stocks in general bottomed. At the end of August, it stood at 81.7 million – a five-month low.
Post-presidential election in November 2016, small-caps benefited from two other perceived tailwinds. One, because they are domestically focused, they were perceived to benefit more from last December’s tax cuts than their large-cap brethren. Two, in case a serious trade war ensues between the US and China, the conventional wisdom says small-caps get hurt less. For the believers, both these are still a factor. Yet, small-caps are kind of stalling.
This comes in the midst of yet another high in the NFIB optimism index, which in August increased nine-tenths of a point month-over-month to record 108.8. In October 2016, the index read 94.9. That said, even here a divergence has developed. Even as small-business optimism is at a record high their capex plans are nowhere near. In August, this sub-index rose three points m/m to 33, which was the highest since February 2006 but much lower versus prior highs (Chart 4).
Granted the NFIB index is survey-based (soft data), but for the Russell 2000 to continue higher, all the wheels probably need to move in sync. This is more medium- to long-term. Near-term is another matter.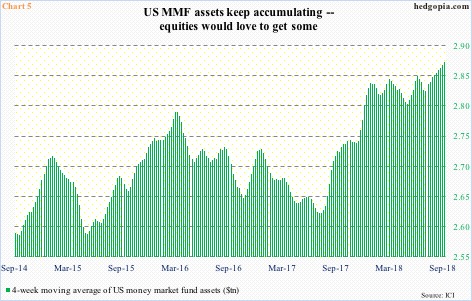
For now, one particular data point equity bulls likely are salivating over is portrayed in Chart 5. Money continues to move into money-market funds. In the week through last Wednesday, there was $2.88 trillion in these funds – an eight-year high. On a four-week moving average basis, funds totaled $2.87 trillion. The green bars have been rising since bottoming in July last year.
At some point, some of these funds will move into other assets – bonds, stocks, or some other asset. Equity bulls obviously hope they find a home in stocks. Having defended crucial support last week, they have done their part. Now, other pieces of the puzzle need to fall into place.
It increasingly feels like at least a section of the market is beginning to position this way. In the past three sessions, the CBOE equity-only put-to-call ratio came in at 0.55, 0.50 and 0.58. The 21-day average was 0.596 last Friday, having dropped from 0.617 a week ago. This already reflects plenty of optimism on the part of longs. That said, on January 26 when stocks began to sharply reverse lower the ratio dropped all the way to 0.543 (Chart 6). Accordingly, the 21-day average of the ISEE index, which is a call-to-put ratio hence inverted, has been rising since late July.
In the right circumstances for the bulls, there is room for these ratios to continue on the current trajectory. Should things pan out this way – let us say the green line gets to low- to mid-0.50s – that would be the time to absolutely get out the caution hat. But between now and then, stocks can rally. This is the best-case scenario for the bulls, who would have increased their odds significantly should stocks come under pressure in the next few sessions and that weakness gets bought.
Thanks for reading!

