
Something is afoot in the bond land – in how bond shorts are viewing things. They have used the sharp decline in the 10-year T-yield post-December 13th FOMC meeting to aggressively go short these notes, betting on higher rates. They are probably right tactically but not strategically; in the latter, they make a killing as inflation makes a resurgence. Else, they are forced to cover, leading to even lower rates.
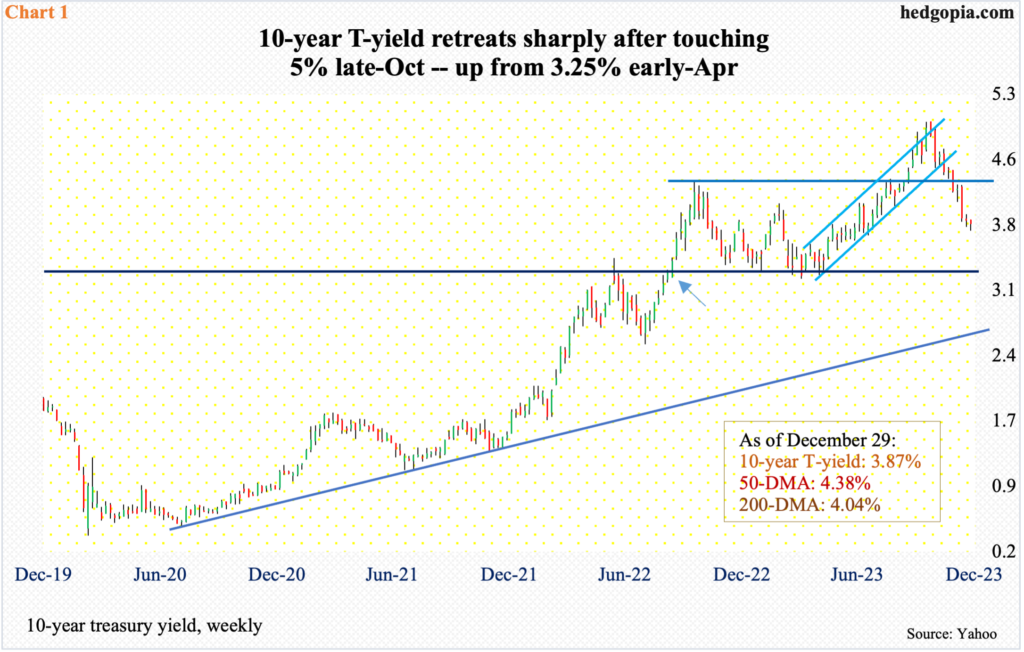
The 10-year treasury yield suffered its second consecutive down month in December, down 49 basis points, following a 52-basis-point tumble in November. Yields peaked at five percent (4.997 percent) last October. This was the highest print since July 2007; back then, the 10-year peaked at 5.32 percent in June and soon rolled over, as the financial crisis of 2007-2008 got underway. Yields fell as low as 0.4 percent (0.398 percent) come March 2020.
This time around, rates have risen a lot in a short period of time. After going sideways for several weeks at 3.2s, the 10-year began to lift off in April last year. This level represented a high from October-November 2018, and bond bears (on price) had to wait until September 2022 before staging a breakout (arrow in Chart 1), followed by a successful retest in March-April last year. Even before reaching a low of 3.25 percent in April 2023, the 10-year dropped to 2.53 percent in August 2022 and 1.13 percent in August before that.
The drop from the October 23rd high has been swift. On December 13th when the FOMC met for the last time last year, making a dovish pivot, expecting three 25-basis-point cuts this year, up from two at the September meeting, the 10-year sliced through its 200-day moving average, having already lost the 50-day mid-November. Subsequently, last Wednesday, yields fell as low as 3.79 percent, ending the week at 3.87 percent.
Odds favor the 10-year rallies from here. The daily particularly is extremely oversold, with the RSI, having remained sub-30 for most of two weeks, rallied above that threshold late last week. Immediate resistance lies at 4.1 percent, with the 200-day at 4.04 percent.
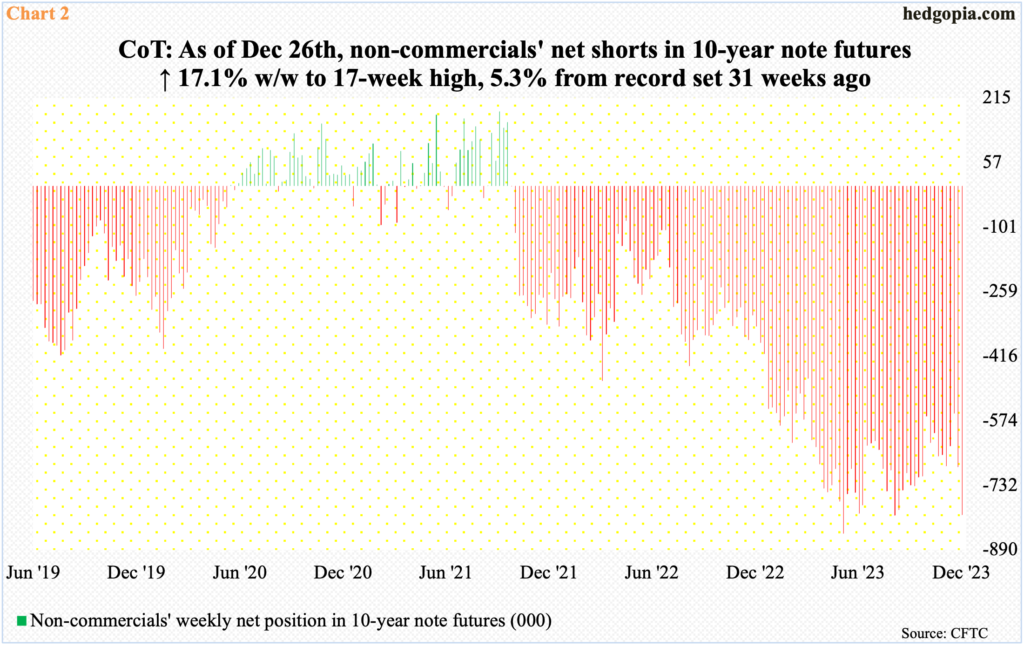
In the futures market, non-commercials continue to bet that rates on the long end of the treasury yield curve are headed higher. Given where yields are currently, tactically, these traders probably have it right. But if this move is strategic and long-term in nature, then a lot needs to go right.
Last week, as of Tuesday, non-commercials’ net shorts in 10-year note futures, went up 17.1 percent week-over-week to 804,984 contracts, coming on the heels of the prior week’s 23.5-percent gain. Holdings are now within spitting distance of the record 850,421 contracts posted in the week to May 30th (Chart 2).
In the week to December 12th, which was the week the FOMC met, these traders held 556,931 contracts. They are obviously using the drop in yields as an opportunity to add to net shorts, betting that the rates could not go any lower. It is likely they will be proven right near term as the 10-year unwinds its oversold conditions. But if non-commercials are in it for the long haul strategically, then they are probably betting on inflation making a resurgence this year.
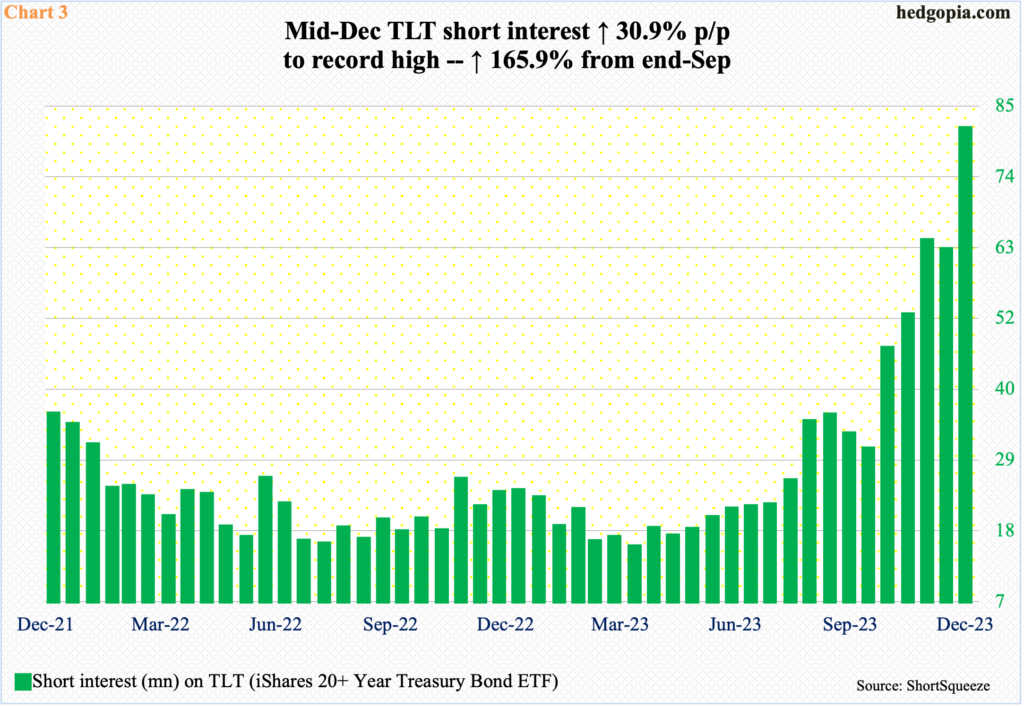
Incidentally, besides futures, bond bears are also using TLT (iShares 20+ Year Treasury Bond ETF) to express their negative bias on prices (and positive in terms of yields).
Mid-December, TLT short interest jumped 30.9 percent period-over-period to 80.8 million – a fresh record. Short interest has catapulted higher since the end of September, when there were 30.4 million shares short (Chart 3). Even before that, at the end of March, short interest was 15 million; the 10-year yielded 3.49 percent then.
Shorts began to show genuine aggression ahead of last October’s peak in yields and have maintained – even added to – their holdings as the 10-year rate went south. They need inflation to begin to misbehave.
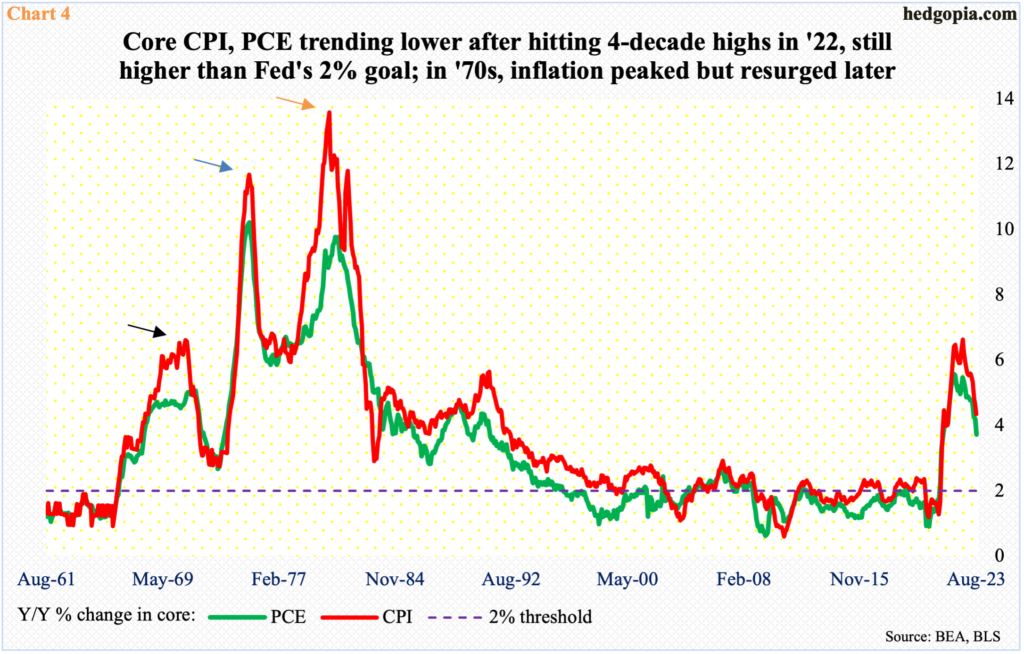
Thus far, consumer inflation has behaved. It peaked in 2022 at four-decade highs and has trended lower since.
On a core basis, from a year ago, PCE (personal consumption expenditures) and CPI (consumer price index) inflation grew 5.6 percent and 6.6 percent in February and September 2022, in that order. By last November, the annual pace had decelerated to 3.2 percent and four percent respectively. This is still much above the Federal Reserve’s two-percent goal, but the trend is going the right direction. The central back prefers core PCE.
Historically, in the ’70s, there were several times when inflation receded but only to pick up steam in subsequent months (arrows in Chart 4). If this phenomenon repeats itself as 2024 progresses, bond bears stand to make a killing.
Post-Fed pivot, financial conditions have eased, with equities, which were already rallying from their late-October trough, further adding to gains, helping create trillions in wealth. The resultant wealth effect has room to positively impact consumer spending and put upward pressure on prices. At least that seems to be how bond bears are looking at things.
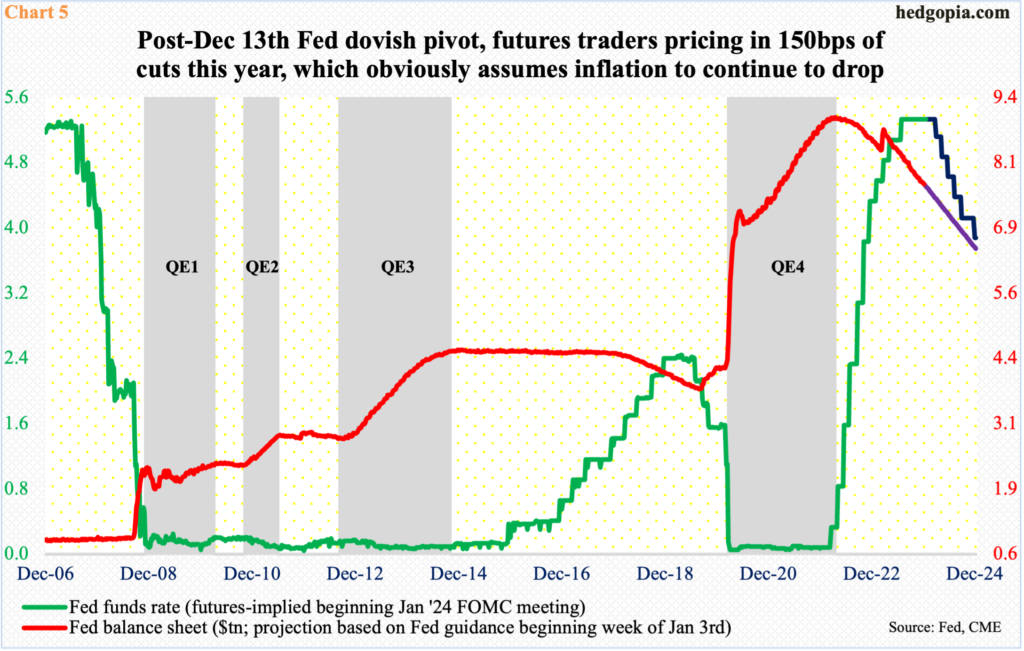
In this scenario, the December 13th Fed pivot itself will be turned on its head, not to mention the futures traders who are currently expecting 150 basis points of cuts this year. Going into the December 12-13 FOMC meeting, they expected four 25-basis-point cuts this year. Post-pivot, this was immediately raised to six, expecting the fed funds rate to end 2024 between 375 basis points and 400 basis points. The benchmark rate currently stands at a range of 525 basis points to 550 basis points, which were raised from zero to 25 basis points in March 2022 (Chart 5). The Fed is also reducing its balance sheet, which is on pace to reach $6.4 trillion by the end of the year, down from the April 2022 peak of $9 trillion.
Alternatively, in the event inflation continues to decelerate, there comes a time when bond bears will be forced to cover, potentially setting in motion a self-fulfilling prophecy of lower rates leading to even lower rates. In this regard, last April’s lows, and the associated horizontal support (Chart 1), is worth watching. Shorts will come under tremendous pressure to cover if this level gets breached.
Thanks for reading!
