
The Tax Cuts and Jobs Act of 2017 – signed into law on December 22 last year – allows U.S. companies to repatriate the cash they have socked away overseas by paying 15.5 percent, rather than the previous 35 percent. The corporate tax rate also got reduced from 35 percent to 20 percent.
There is widespread hope among investors and policymakers that this would boost corporate capital expenditures.
It has been less than three months since these cuts became effective, so it is too soon to conclude how things would pan out, but early signs are not very encouraging.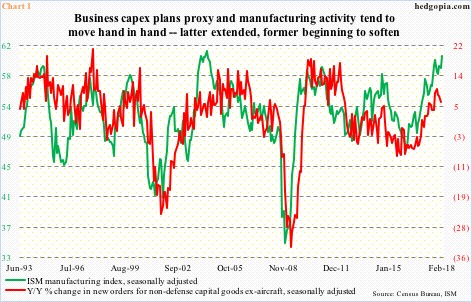
Orders for non-defense capital goods ex-aircraft – proxy for business capex plans – rose 6.3 percent year-over-year in January to a seasonally adjusted annual rate of $66.7 billion. Growth has been decelerating since peaking at 9.9 percent last October (Chart 1).
These orders peaked a while back – at $70.3 billion in September 2014 – and have been rising since bottoming at $59.9 billion in May 2016; this is the reason why y/y growth looks so good. Month-over-month, orders fell in both January and December. This alone does not mean the recent deceleration in growth momentum could not reverse higher.
The green line in Chart 1 therefore provides additional context. The ISM manufacturing index rose 1.7 points m/m in February to 60.8 – the highest since 61.4 in May 2004. It has gone up 10.9 points since August 2016, and, in all probability, needs a rest. Directionally, the green and red lines move together.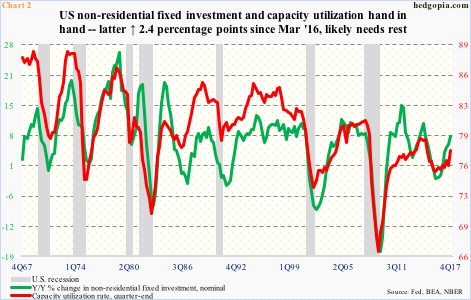
The improvement in the capex trend particularly last year is also evident in Chart 2. The green line represents y/y percent change in nominal non-residential fixed investment. In 4Q17, it rose 7.6 percent to $2.51 trillion. The growth rate has trended higher since contracting at 1.6 percent in 1Q16. In 4Q17, non-residential fixed investment as a percent of nominal GDP accounted for 12.7 percent, up from 12.3 percent four quarters earlier. Once again, nothing says it cannot continue higher.
Here is the thing.
The green line in the chart tends to move in tandem with the red line, which is the capacity utilization rate. This at a time when ISM manufacturing is at a multi-year high and is likely to soften in the months ahead. In this scenario, the likely path for utilization is down, and capex should follow.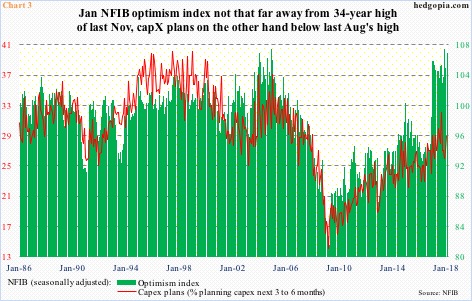
Chart 3 adds some additional color to this. The NFIB (National Federation of Independent Business) optimism index has remained north of 100 since December 2016. In October that year, it read 94.9, then surging post-presidential election a month later. In November last year, it rose to a 34-year high 107.5, with this January at 106.9.
But this jump in optimism has been met with a rather subdued capex outlook – potentially revealing given that small businesses, because they are domestically focused, do not stand to benefit much from the afore-mentioned repatriation factor but do from cuts in taxes and regulations.
Yet, their capex plans in January stood at 29, up two points m/m but lower than 32 last August. Not to mention the fact that in the past the red line has been much higher.
To sum things up, both soft and hard data point to rising odds that the Act’s impact on capex will remain muted – at least in the next several months/quarters.
Thanks for reading!
