
Breakouts galore in U.S. equity indices!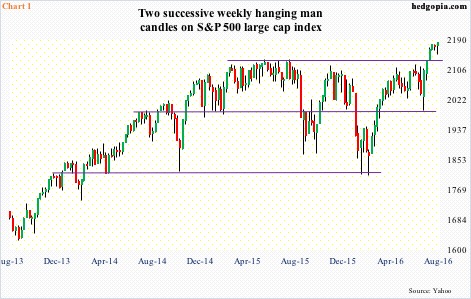
The S&P 500 large cap index broke out to a new all-time high on July 11th, and has since made several more highs. The breakout came after having gone sideways since essentially February 2015 (Chart 1). Of late, there are some signs of fatigue, but bulls are keeping the tempo.
Until Thursday last week, the index was down 0.4 percent. Then came July’s much-stronger-than-expected employment report, resulting in Friday’s 0.9-percent rally. It is probably a stretch but some can argue last week’s low of 2147.58 was a breakout retest of the May 2015 high of 2134.72 – so far successful.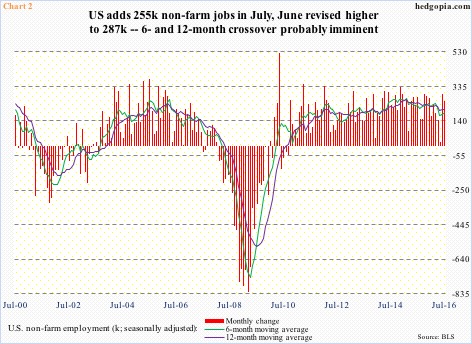
The Friday reaction was a by-product of back-to-back strong job creation in the U.S. July produced 255,000 non-farm jobs, following upwardly revised 292,000 in June. This came on the heels of a mere 24,000 jobs in May, hence the palpable sigh of relief heaved by the markets.
In Chart 2, six- and 12-month moving averages of monthly non-farm employment have been calculated, with the former having crossed under in March 2015. (Once again, the S&P 500 essentially went sideways since February 2015 before breaking out this July.) In the 16 months since, the six-month average has remained below the 12-month in 12. Momentum is down, except it is beginning to hook up. Assuming non-farm payroll averages 125,000 per month for the next four months, the six-month would have crossed over by November.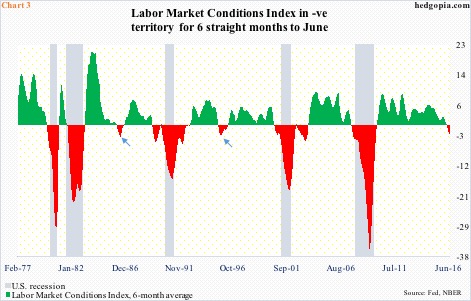
If you were Janet Yellen, Fed chief, you have a tough task at hand. Should she, and the Federal Open Market Committee, listen to the message coming out of non-farm payroll or heed the message the Labor Market Conditions Index (LMCI) is sending?
The LMCI, introduced by the Fed in 2014, uses 19 economic indicators, and is geared toward measuring the labor market’s momentum. Through June, it has been in negative territory for six consecutive months. Chart 3 calculates a six-month average, and is rather revealing.
Going back to August 1976, the average has turned negative eight times, including one currently, and except for 1986 and 1995 (arrows in Chart 3), the other five times were followed by recession.
Last Friday, various asset classes acted as if the Fed was going to heed the message coming out of the jobs report. Two-year Treasury yields – most sensitive to the Fed’s monetary policy – rallied eight basis points to 0.72 percent, although yields are substantially below the 1.09 percent last December. XLF, the SPDR financial ETF, jumped 1.9 percent to an eight-month high. The US dollar index rallied 0.5 percent, and is once again eyeing the 200-day moving average.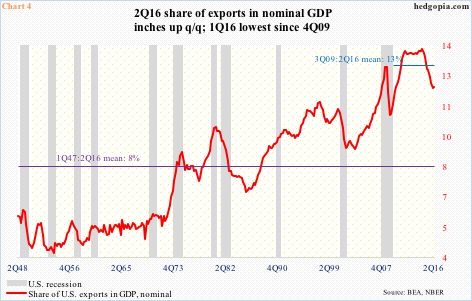
Hence the question, if August prints another healthy number, is the September 20-21 meeting a go? The FOMC does have a press conference scheduled in that meeting. A hike, or any hint leading up to it – not a base case on this blog – raises the odds that the dollar index (96.17) at least heads toward the upper end of the 93-101 range it has been in since March last year.
In this scenario, Chart 4 is apropos. From 13.8 percent in 2Q14, U.S. exports’ share in nominal GDP dropped to 11.9 percent in 1Q16 – the lowest since 4Q09. The red line in the chart inched up to 12 percent in 2Q16. The peak two years ago coincides with the 25-percent rally in the dollar index that began in July 2014. The rather sideways move since March last year has not hurt exports, if not helped. A rally here has the potential to reverse this.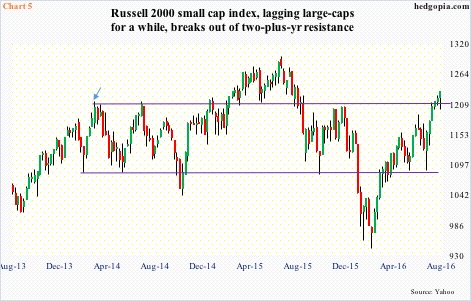
Real GDP grew a mere 1.2 percent in 2Q16, following even weaker 0.9 percent in 4Q15 and 0.8 percent in 1Q16. The Atlanta Fed’s GDPNow model is forecasting 3.8 percent growth in 3Q (as of August 5th). Inventory reduction has subtracted from growth in the past five quarters, so could be snapping back.
Expectations of faster economic growth has helped small-caps, which inherently tend to have sole/high exposure to the domestic economy.
Except for a false breakout in February last year, the Russell 2000 small cap index had been trading within a wide range since March 2014 (arrow in Chart 5). Last week, it further built on the rather meek breakout of the prior week. Although the Russell 2000 is still five-plus percent from its June 2015 all-time high, the fact that it belatedly jumped on the breakout bandwagon should be a morale-booster for the bulls. In this respect, the S&P 500 and Dow Industrials blazed the trail, later joined by the Nasdaq 100 index.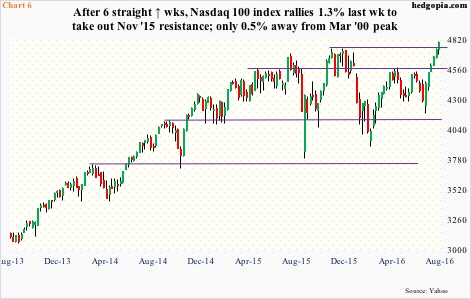
Speaking of which the Nasdaq 100 is a mere 0.5 percent from its March 2000 all-time high. It is now up for six straight weeks, and in the process first took care of April 2015 horizontal line resistance, followed by one last week (Chart 6). The latter resistance goes back to November last year. Flows are helping, with QQQ, the PowerShares Nasdaq 100 ETF, drawing $1.1 billion in the week ended last Wednesday; in the prior week, $893 million came in (courtesy of ETF.com).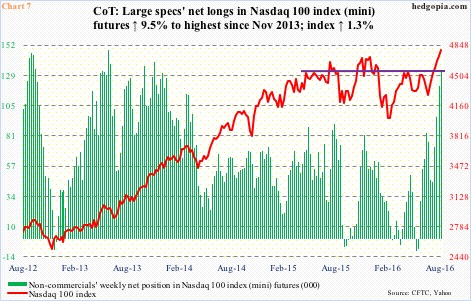
The mood is festive. It almost feels like non-commercials are close to – if not already – being all in. As of Tuesday last week, net longs in Nasdaq 100 (mini) index futures were 131,679 contracts – the highest since November 2013. As early as the week ended May 17th, these traders were net short 7,600 contracts (Chart 7). Now they are heavily net long. During the period, the Nasdaq 100 rallied nearly 10 percent. From one extreme to the other. Unwinding of these longs can be painful for the longs, as they were for shorts when they gradually got squeezed out.
The advantage the bulls have right now is that momentum is intact. But risks are rising. The VIX-to-VXV ratio has been in oversold territory the past six weeks, with the last four in the mid to high 0.70s and the first two in the low 0.80s (Chart 8). Last Friday’s reading of .752 was a four-year low.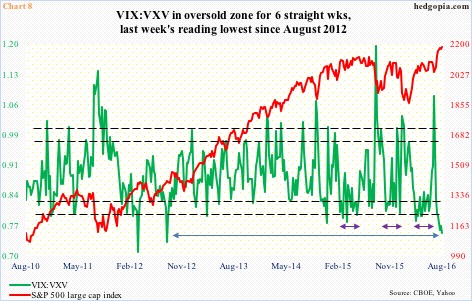
That said, in the past year and a half, there have been three occasions in which the ratio has gone sideways for extended periods (indigo bi-directional arrows). The last one, beginning mid-March this year, lasted 12 weeks before it suddenly came to life. Can it continue to stay suppressed for a while longer? Always possible, now that major indices have breakout tailwind. Equally possible – even probable – in this scenario is a material increase in prospects for a blow-off top.
Thanks for reading!
