
- Amidst deteriorating U.S. earnings picture and geopolitical uncertainty, stocks resilient
- Major indices break out, but how much buying power did bulls expend?
- Breakouts deserve respect, unless they are proven false
Are U.S. equities trying to tell us something?
Almost out of nowhere, one can smell a change in the air. Is it genuine or fleeting?
Breakouts are galore. The S&P 500 large cap index (2097) bounced off 1990-2000 and the move higher since has it now trading at an all-time high (Chart 1). If February closes at the current level, or higher, then that should help negate the rather bearish price action of December and January (best seen on a monthly chart; below is daily).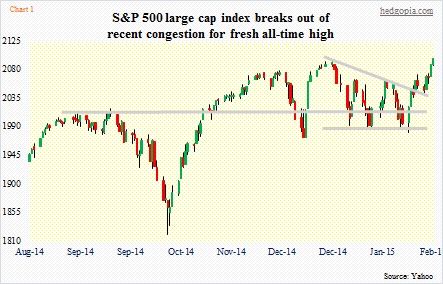
Action in tech is hot and heavy. Once again, the Nasdaq 100 (4384) refused to give away 4100, having successfully tested that level four times the past couple of months. Early this month, there was another test. Not only did it hold, but a subsequent sling shot was strong enough to break the index out of the descending triangle it was in (Chart 2). AAPL holds the key; price action has a parabolic feel to it, but there are so far no signs of distribution.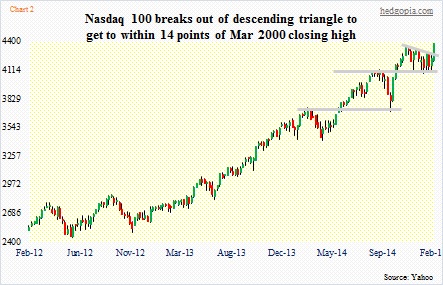
The hitherto-lagging Russell 2000 small cap index (1223) also notched a new high – ever so slightly, though. Since it lost a November 2012 uptrend line in March last year, it went sideways the entire 2014. The index broke out of the 100-point range late December, but it turned out to be a false one (blue arrow in Chart 3). It then quickly retreated once it became clear that investors were not buying the breakout. With that as a background, the breakout last week is valid until proven otherwise.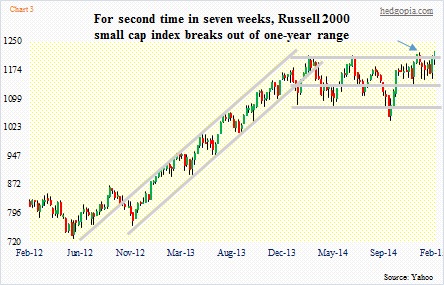
Even as major U.S. indices were breaking out of their congestion, investors seemed ready to take on some risk. Long bonds are selling off, with the ten-year yield having risen from 1.65 percent to 2.02 percent in two weeks. It is now eyeing 2.1 percent, where resistance will be heavy. The ratio of consumer discretionary (XLY) to consumer staples (XLP) just broke out of one-year downtrend line, with four successive solid white candles (Chart 4).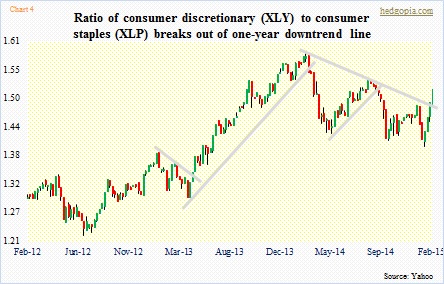
As well, the VIX is selling hard (Chart 5). For more than a couple of years now, it has struggled to sustainably stay above low-20s. In fact, the day stocks bottomed mid-October, it spiked to 31 intra-day only to reverse. The latest reversal took place early February from a little under 23, and in 10 sessions it has given back eight points. It is currently sitting right at its 200-day moving average. A failure to hold means more pressure ahead; weekly indicators have probably more to go on the downside before overbought conditions are unwound.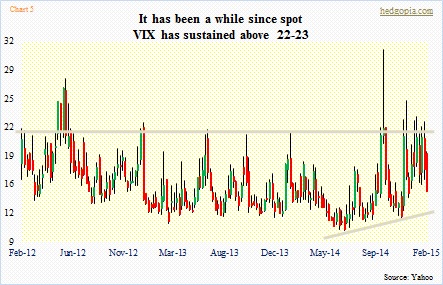
Intriguingly, equities are attracting bids even as the earnings picture is deteriorating. In 1Q13, operating earnings for 2014 for S&P 500 companies were estimated at $125. Not surprisingly, they got progressively revised downward – to $120 in 1Q14 and sub-$116 now. The trend is no different for 2015. As early as 2Q14, the estimate was $138, which has now crashed to $121. Predictably, 2016 is starting out at a very optimistic $138 (Chart 6). Hope springs eternal.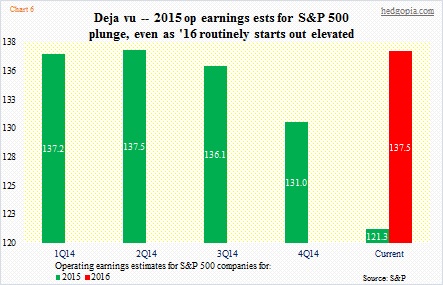
Or maybe this factor is exactly what has caused the buying frenzy of the past couple of weeks. If expectations are met, operating earnings would have grown less than five percent this year. Given what is transpiring in the energy sector, when it is all said and done, this is not a slam dunk. Nonetheless, versus growth expectations of not even a few months ago, the bar is now substantially lower, hence it is easier to meet/beat.
Or is it just a case of shorts getting squeezed? I briefly touched on the topic yesterday.
Here are a few other possibilities. (1) The earnings season is behind us, and it is as good a time as any to buy beaten-down shares. Oil is attracting bids. (2) Going back a couple of years, four- to five-percent dips have consistently been opportunities to buy. The latest seven-session drop was four percent. (3) Important support held on major indices. (4) A ceasefire was signed in Ukraine. And (5) there were signs late last week that the Greece situation looked rocky but would get solved in the 11th hour.
Based on some of the readings I did over the weekend, most people are convinced that this is a new leg to the bull market. Not so fast. A source of funds is always a question mark. This could very well be a part of a topping formation. But we will let the price confirm that.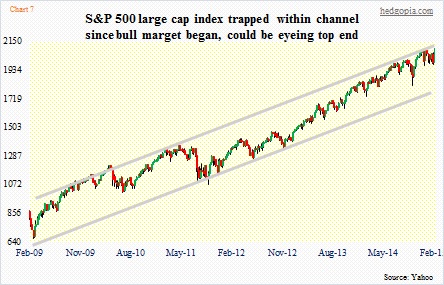
The S&P 500 is still trapped in a channel (Chart 7). This is not any channel we are talking about. It has been there since the bull market began. If the index succeeds in kissing the upper end of that, then there is some upside left. Indeed, in the intermediate term, things are not yet overbought. Near-term, they are, though.
Before we get too excited, here are a couple of things to consider. If the buying was motivated by a desire to preempt an expected amicable solution in Greece, then this is not self-sustaining. If they expect a sustained rally out of oil, then that is a toss-up as well. The hope is that the dollar rolls over from here, which will then end up helping commodities.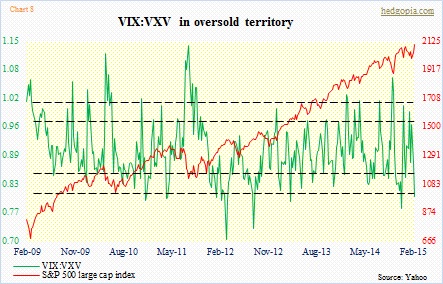
Be that as it may, these are breakouts, and should be respected. Prices have not pulled away from breakout levels. This is true in all the three indices discussed above. A test of these levels is healthy. Looking at VIX:VXV (Chart 8), things are beginning to get stretched near-term. We will find out soon if these are genuine breakouts.
