
Last week, the S&P 500, Nasdaq 100 and Russell 2000 respectively fell 2.3 percent, 0.7 percent and 5.5 percent. Bulls’ consolation is that the indices were down a lot more at Thursday’s lows and that they were able to defend crucial support. A rally near term can push options sentiment into frothy level.
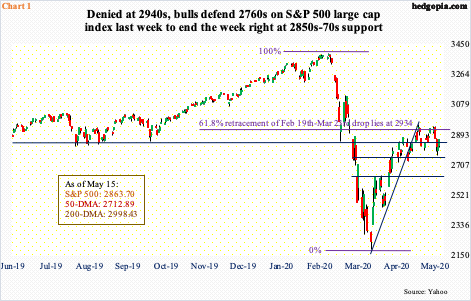
The S&P 500 large cap index traded in an interesting manner last week. Both bulls and bears could claim victory – sort of. On Monday and Tuesday, bulls continued to face resistance at 2940s (Chart 1), which is where the daily upper Bollinger band lied at the time. By Thursday, the index just about tagged the lower band and was down 5.6 percent at the low, which was bought. By the end of the week, bulls reduced the weekly loss to minus 2.3 percent.
For now, the S&P (2863.70) seems rangebound between 2940s and 2760s and sits smack in the middle of crucial support at 2850s-70s – perhaps perfect for iron condor or iron butterfly options strategies for directionally neutral trades.
Either way the index breaks, momentum likely follows. Immediately ahead, if the weekly takes over, odds favor the bears. The weekly RSI, and some other indicators, are turning back down from the median. On the daily, however, the RSI rallied above 50 in early April and bounced off of it a few times, which helped the S&P 500 rally. This occurred again last Wednesday.
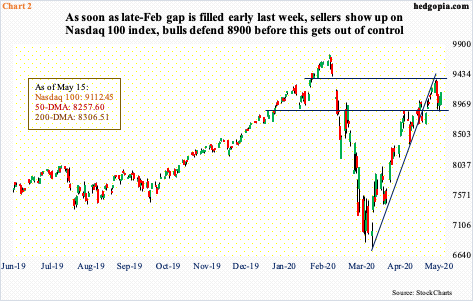
On the Nasdaq 100 as well, the daily RSI turned up above the median last Wednesday. The index acts the strongest of major US equity indices, sitting comfortably above both the 50- and 200-day moving averages. Last Wednesday and Thursday, the 20-day was tested – successfully. Thursday’s low of 8860.77 was a successful test of four-month straight-line support at 8900 (Chart 2). Before this, Tuesday’s high of 9354.45 essentially filled the gap from late February. At that high, the index was merely 4.1 percent from the all-time high of 9736.57 posted on February 19th. The recovery since the March 23rd low has been no less eye-catching than the collapse since the February 19th peak.
As that gap filled, sellers showed up last week. But unless 8900 gives way, it will be early for the bears to be high fiving. Thus far, the March trend-line breach early this month has not borne fruit, with the index rallying all along that broken trend line. For now, the Nasdaq 100 (9152.64) is trapped between 9350-9400 and 8900, even as a weekly long-legged doji formed last week.
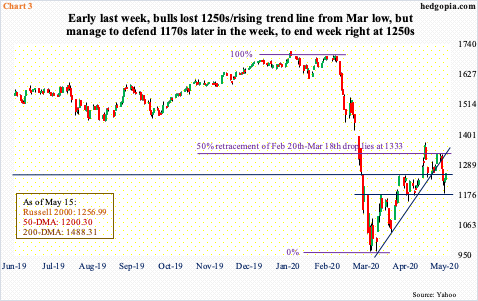
On the Russell 2000 small cap index, a similar trend line from the March low was breached last Tuesday. From 966.22 on March 18th, it rallied to 1373.39 by April 29th, but remaining there proved difficult. As a matter of fact, at 1333 lied 50-percent retracement of the February-March collapse, and this is where bulls and bears were locked into a duel. Last Monday, bulls once again were denied at that level, which then quickly resulted in a two-session tumble.
On Thursday, the Russell 2000 was down 4.2 percent at one time, only to see small-cap bulls step up and defend 1170s-80s; by close, the index edged up 0.4 percent, forming a hammer right on support (Chart 3). At the lows in that session, the index (1256.99) was down 11.2 percent for the week; when it was all said and done, it ended down 5.5 percent, closing right at crucial 1250s – smack in the middle of the current range of 1330s and 1170s.
Thursday’s intraday reversal on the Russell 2000 came in a week in which earnings estimates continued diving off the cliff, with 1Q20 blended estimates having dropped to minus $5.26 last Wednesday. When the quarter ended in March, the sell-side expected $8.07. In January 2019, it was $16.01!
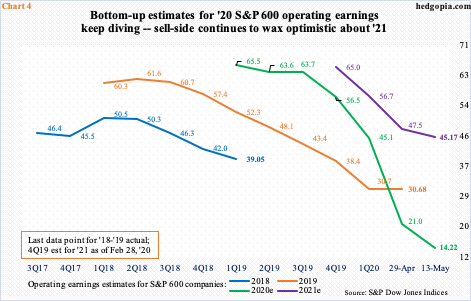
Last Wednesday, 2020 estimates for S&P 600 companies declined further to $14.22, down from $17.91 six days ago – and $67.63 in February last year (Chart 4). The way small-cap stocks are behaving, it increasingly feels like they have essentially written off 2020 and looking out to 2021, which once again models in elevated optimism. Earnings next year are expected to soar 218 percent, after falling 54 percent this year and 21 percent last year.
Going by the revision trend, bottom-up estimates have consistently tended to be optimistic. Unless it is different this time, next year’s should meet the same fate.
Last Friday, two important data were released – April’s retail sales and industrial production. Both were horrendous. They nonetheless elicited the same market reaction as have done the rapidly deteriorating earnings estimates particularly for this year – a yawn! Major US indices shook off morning weakness to end the session in the green.
How bad were the data! Gosh, they were bad!
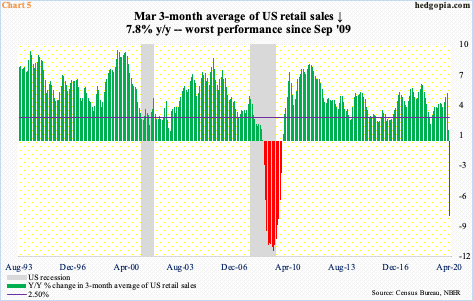
April retail sales collapsed 16.5 percent month-over-month and 21.6 percent year-over-year to a seasonally adjusted annual rate of $403.9 billion – the lowest total since August 2012 (chart here). On a three-month average basis, sales contracted 7.7 percent y/y (Chart 5); it is all but certain May’s will be worse. Similarly, industrial production in April tumbled 11.3 percent m/m and 15 percent y/y to the lowest level since February 2010. By the way, the S&P 500 is diverging with industrial production (chart here).
Markets are beginning to look past this and into what optimists hope to be a V-shaped economic recovery.
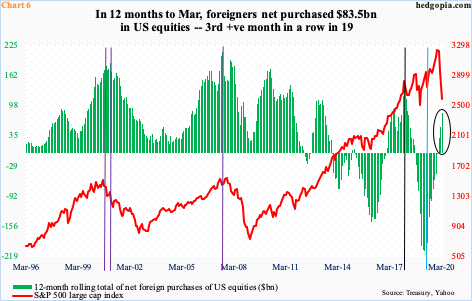
We can throw foreigners into this category. In the 12 months to March, they purchased $83.5 billion in US equities. In March, the S&P 500 dropped 12.5 percent and was down as much as 25.8 percent at the lows. This followed an 8.4-percent drop in February. Foreigners bought $11.5 billion and $6.8 billion worth in February and March respectively. In essence, they treated the two-month collapse as an opportunity to add. They have been right thus far, but longer-term, time will tell.
Incidentally, as recently as April last year, they were selling at a $214.6-billion pace on a 12-month basis – a record (blue vertical line in Chart 6). They have made an impressive U-turn since. This series is a little outdated, so April’s numbers will be a big tell.
Immediately ahead, momentum was slipping out of bulls’ hand last week, but they stopped it in its tracks in the latter two sessions. The S&P 500 closed last week right between the 10- and 20-day. A rally past the averages raises the odds that 2940s gets tested again.
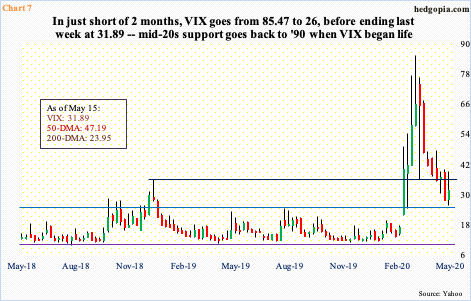
Concurrently, VIX’s intraday reversal higher last Tuesday came after tagging 26 right on the daily lower Bollinger band. This is a major support zone going back several years (Chart 7). Volatility bulls were able to defend this level, but at the same time have been unable to take out 36-38, despite attempts both on Wednesday and Thursday. The 20-day consistently came in the way.
On the daily, the RSI has remained below 50 since early April. Several attempts since to recapture the median have failed, including last week. Some other indicators such as the stochastics, too, seem to want to turn back down from the median. This raises the odds that VIX (31.89) at least heads back lower toward last week’s low. The 200-day rests at 23.95. VIX has not lost the average for nearly three months now.
Equity bulls have an opportunity here – magnitude and duration notwithstanding – let us see if they can cash in.
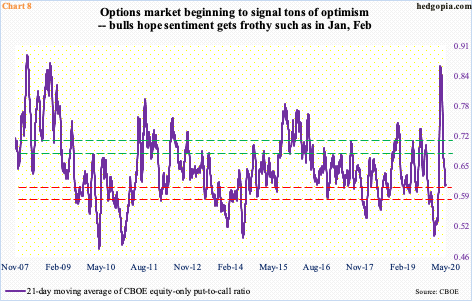
If the aforementioned three indices – S&P 500, Nasdaq 100 and Russell 2000 – rally toward 2940s, 9350-9400 and 1330s-70s respectively, the 21-day moving average of the CBOE equity-only put-to-call ratio has a chance to get frothy.
Last week, the ratio ended at 0.614, and was 0.611 on Tuesday (Chart 8), which was the lowest reading since March 4th. On January 17th, it dropped to as low as 0.501 and was nearing mid-0.50s when the rug was pulled out from under the S&P 500 on February 19th. Greed was palpable back then. The resulting unwinding ended with the ratio peaking at 0.867 on March 20th when fear ruled. Once again, sentiment is lurching toward greed. Historically, it has paid to play cautious as the ratio nears mid- to high-0.50s. A rally in stocks near term can push it toward that frothy stage, which will be an opportunity for shorts to get aggressive.
Thanks for reading!
