
Major US equity indices are within striking distance of July highs. Sentiment took a small hit in recent weeks and has room to rise. How markets react to lowered 3Q19 earnings estimates will decide if bulls will be able to build on last week’s momentum.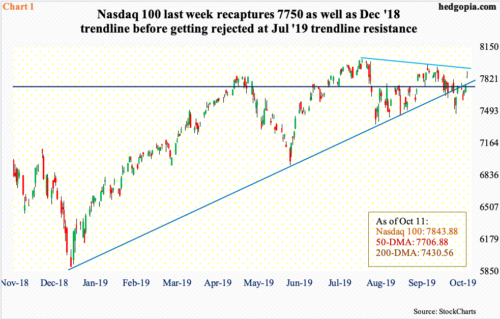
In the last two weeks, bulls used weakness in the first half of the week to get long stocks. Last week, the S&P 500 large cap index and the Nasdaq 100 index, and several other major US indices, tried to rally on Monday but only to end the session down right on the 50-day moving average. Downward momentum continued on Tuesday.
Between Monday’s intraday high and Tuesday’s low, the Nasdaq 100 shed 2.3 percent (Chart 1). In the next three sessions, the loss was more than erased. By the end of Friday, it was up 1.2 percent for the week.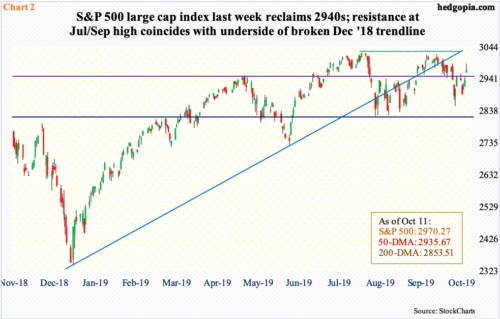
Over on the S&P 500, things evolved similarly. It, too, was down 2.3 percent between Monday’s high and Tuesday’s low, and it, too, recovered in the next three sessions to end the week up 0.6 percent.
In the process, the index (2970.27) reclaimed 2940s, which has proven to be an important price point going back to September last year (Chart 2). The Nasdaq 100 (7843.88) similarly reclaimed 7700-7750, which goes back to August last year.
Both these indices also were back above their respective 50-day. On both, the average is now flattish and is trying to curl up.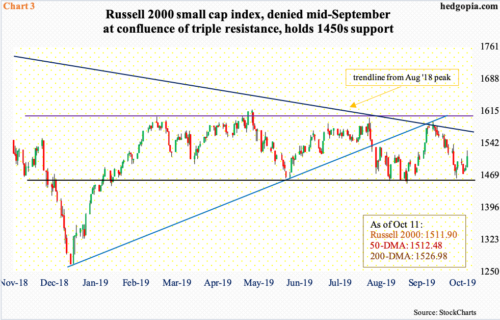
The Russell 2000 small cap index (1511.90) is right at the 50-day but below the 200-day. Other than that, it behaved similarly last week – weakness on Monday and Tuesday and strength in the remaining three sessions. By the time the week closed, it was up 0.8 percent.
Earlier – seven sessions ago, to be precise – small-cap bulls defended support at 1450s, which goes back to July 2017. This probably laid the foundation for the improved tone last week.
That said, bulls would have liked to finish the week on a stronger note. Friday, the indices finished strong, but bulls were unable to hang on to all the gains, resulting in a shooting star. The Nasdaq 100, in fact, got stopped right at trend-line resistance from the all-time high set in July this year (Chart 1). Similarly, the Russell 2000 was rejected Friday at the 200-day (Chart 3). Near-term, the index faces short-term resistance at 1520s. A breakout, followed by reclaiming of the 200-day will strengthen bulls’ case. This potentially opens the door to a test of trend-line resistance from last August around 1570.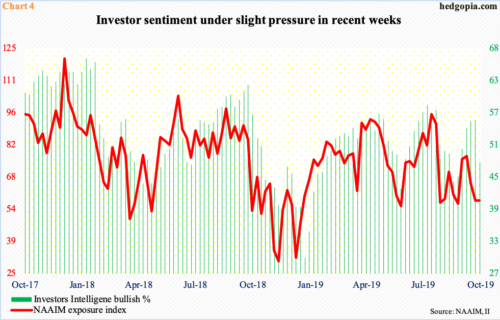
In this scenario, investor sentiment can continue to improve. And there is room for this to happen.
In the latest week, Investors Intelligence bullish percent dropped 7.7 percentage points week-over-week to 47.6 percent – a five-week low. Mid-July – right before major equity indices peaked later that month – bulls peaked at 58 percent, before dropping to 43.9 percent late August.
Likewise, in the week ended July 24, the NAAIM exposure index registered 95.8 percent. The reading represents the average exposure to US stocks by NAAIM members. Last week, their count stood at 57.3 percent (Chart 4).
The question is if these sentiment metrics continue lower in the weeks ahead or recover. Immediately ahead, momentum is on bulls’ side. The S&P 500 and the Nasdaq 100 in particular have broken out of the range that they found themselves in throughout August. They are within striking distance of their late-July record highs. Some hesitancy makes sense, which is what was evident last Friday.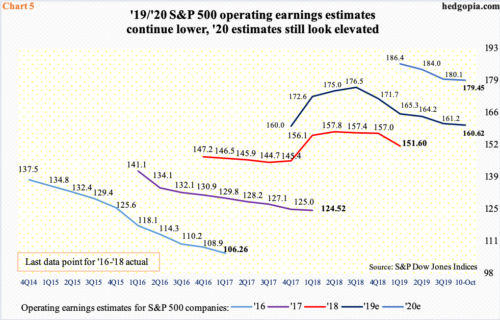
Ideally, bulls hope the 3Q19 earnings season, which begins in earnest this week, will come to their rescue. And this could very well happen in the next few weeks, as the bar keeps getting lowered.
As of last Friday, S&P 500 companies were expected to ring up $40.50 in operating earnings in 3Q19. This is down from $42.47 when the quarter began. Go back further to last November and these estimates were $45.11.
The sell-side is notorious for starting out on a very optimistic note and then gradually lower their numbers as the time to report gets near. The downward revision trend holds true for both this year and next (Chart 5).
This year, the consensus has come down to $160.62 currently from $177.13 in August last year, while next year’s has gone from $186.36 in March this year to $179.45. As things stand, 2020 earnings would have still grown about 12 percent, which is hard to swallow given the US economy is in its 11th year of expansion. The cycle is long in its tooth, and there are signs of wear and tear.
Hence the significance of how investors treat this earnings season. Yes, the bar is low. But at the same time, markets are well aware of this fact, and this could very well be in the price. One session does not make a trend, but Friday’s shooting star shows things are still jittery, which should continue to be the case until the July highs are taken out.
Thanks for reading!
