
Small-caps and large-caps went their own separate ways for a while, with the Russell 2000 peaking as far back as August 2018 and the S&P 500 in February this year. Since the trough this March, they have been on the same page in that they have both failed to surpass the highs from February. The Nasdaq 100, on the other hand, has rallied to a new high. Both the S&P 500 and the Russell 2000 are playing ping pong within a month-or-so-long range.
The Nasdaq 100 index acts strong – relatively, that is. Of the major US equity indices, it, along with the Nasdaq composite, is the only one to have rallied to a new high after bottoming in March.
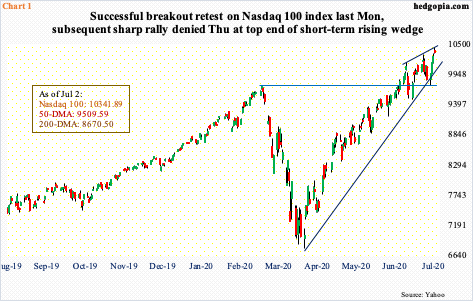
From the March 23rd low of 6771.91 to last Thursday’s high of 10432.55, the Nasdaq 100 (10341.89) jumped north of 54 percent, although bulls were unable to hang on to all of the gains in that session. Thursday’s intraday high kissed the upper bound of a short-term wedge (Chart 1). In the prior two touches as well, candles with long upper shadows resulted.
Should weakness develop near term, the path of least resistance is toward the prior peak from February, which bulls defended on Monday last week, before catapulting higher. In a holiday-shortened week, the Nasdaq 100 surged five percent last week.
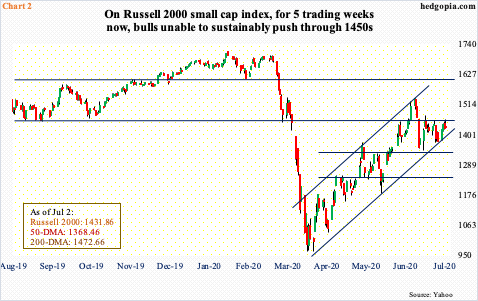
The Russell 2000 small cap index (1431.86) was not so lucky but managed to rally 3.8 percent anyway. Like the Nasdaq 100, it, too, failed to hang on to all the gains on Thursday, when the session high of 1459.41 was rejected – once again – at horizontal resistance at 1450s (Chart 2). This has been an important level for both bulls and bears going back three years.
Most recently, after bottoming in March, the Russell 2000 hesitated at 1450s late May before pushing through. The breakout was short-lived. The subsequent drop found support at 1330s as well as the lower bound of an ascending channel from March. Channel support lies around 1400, a breach of which opens the door toward 1330s.
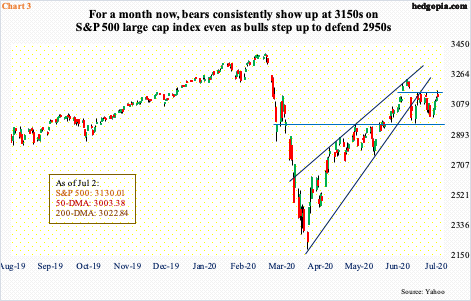
Similar dynamics are in play on the S&P 500 large cap index. Last Thursday, it tagged 3165.81 intraday but ended up closing at 3130.01. Once again, bears defended horizontal resistance at 3150s. This preceded an island reversal 16 sessions ago, which coincided with a rising wedge breach (Chart 3). Before this could morph into serious selling, bulls defended support at 2950s, and both the 50- and 200-day last Monday.
In essence, similar to the Russell 2000, the S&P 500 is trapped in a range – between 3150s and 2950s. Since it was just rejected at the upper bound, odds favor there are more offers than bids near term.
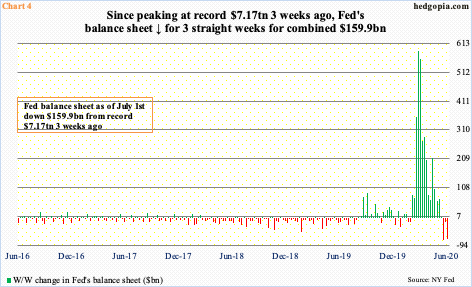
The sideways action in both large- and small-caps is coming at a time when the Fed’s assets are no longer growing. The balance sheet reached an all-time high of $7.17 trillion in the week to June 10th. Incidentally, the S&P 500 peaked on June 8th with an intraday high of 3233.13. On March 23rd when the index, as well as US stocks in general, bottomed, the Fed announced unlimited QE (quantitative easing) and said it would start buying investment-grade corporate bonds, which was later expanded to include junk. The Fed’s actions are having an impact on investor psyche.
Since the June 10th high, the balance sheet has gone down by $159.9 billion, to $7 trillion, dropping for three consecutive weeks (Chart 4). Thus far, investors have taken this in stride. Before this, the balance sheet expanded by just under $3 trillion in three months, which needless to say is massive. Viewed this way, the latest reduction simply pales in comparison to the preceding expansion.
That said, it is important to remember that both the balance sheet and the S&P 500 peaked in the same week last month.
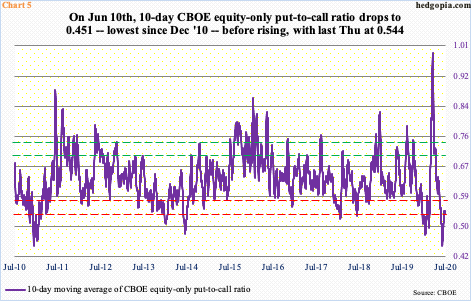
This was also when the 10-day moving average of the CBOE equity-only put-to-call ratio bottomed, which took place on June 10th; the 0.451 reading was the lowest since December 2010. To reiterate, the S&P 500 peaked on the 8th. The index is down 3.2 percent from that high.
By last Thursday, the 10-day ratio had risen to 0.544. In the big scheme of things, it has a ways to go before the optimism built into these frothy readings get unwound. If past is prologue, it has room to rise to low- to mid-0.70s before sentiment swings the other way – from the current greed phase to that of fear.
In this scenario, the current rangebound action on the S&P 500, as well as on the Russell 2000, eventually gets resolved with a downside break – if nothing else just to unwind overbought conditions.
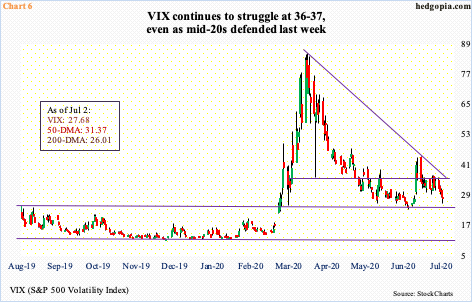
The outlook changes should VIX (27.68) decisively head lower. The volatility index shot up to 85.47 intraday on March 18th. Fear was rampant back then. The only time VIX was higher was in October 2008 when it tagged 89.53. This needed to unwind, and unwind it has.
On June 5th, VIX dropped to as low as 23.54, successfully testing the 200-day. Once again, the average was tested last Thursday – again successfully – as it tagged 25.90 intraday. There is decent support at mid- to high-20s (Chart 6).
For volatility bulls, the problem at hand is two-fold – falling trend line from the March high and horizontal resistance at 36-37. The latter has repelled rally attempts for two months now, hence its significance. A takeout of this roadblock probably opens the door to higher volatility, which likely accompanies range breakdown on the S&P 500 and Russell 2000.
Thanks for reading!
